Why we’re building Canvas, a data tool for “non-technical” teams
The year is 2017. I had just joined Flexport as one of the first product managers and was thrilled to start working on the unsexiest trillion-dollar startup.
Inside Flexport’s office, Periscope dashboards are everywhere. On day one, you get access to nearly all of the company’s data. I browsed each dashboard’s key sales, financial, and operational metrics. I was blown away by the transparency and the company’s obsession with data, but that astonishment quickly turned into panic.
An identity crisis
I joined Flexport to build a new area of the product. I had many questions about who was using it, why they were using it, which features they were adopting, and what we needed to build to address the problems I soon heard about from dozens of stakeholders.
I knew SQL basics, but I didn’t have a dedicated data analyst to help me answer more detailed questions. And I didn’t want to keep shoulder tapping the engineers on my team every day for new questions. I needed to present a quantitative case for our roadmap, and if I couldn’t, our team wouldn’t get staffed to build the things we needed to build, I would look incompetent in front of leadership, and I soon might be left off the Flexport rocketship.
I took a drastic step to cure my anxiety and signed up for a data analytics boot camp. I paid thousands of dollars out of pocket and spent nights and weekends learning advanced SQL. I was fortunate enough to have the money and time to take the class, but I couldn’t help but think of the millions of other “non-technical” knowledge workers out there who felt the same fear.
The data haves and have-nots
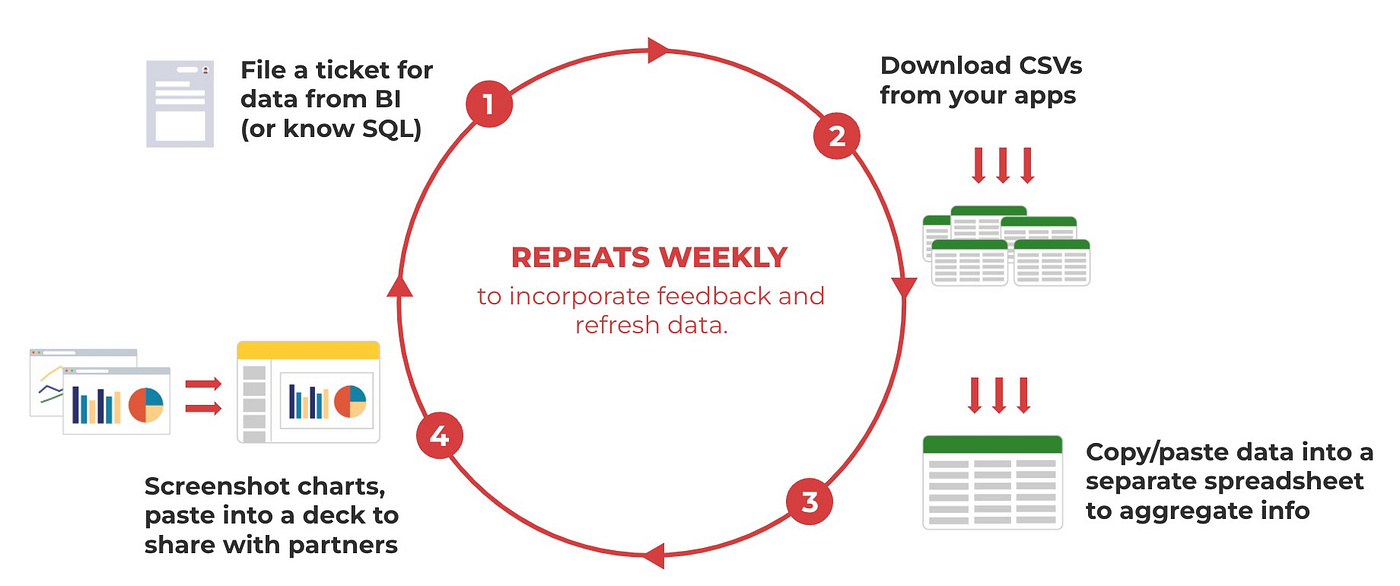
At Flexport, I saw first-hand how often business teams resorted to exporting data out of our BI tools and into spreadsheets. I saw how many ad-hoc requests these teams made to data teams who wanted to help but found themselves overwhelmed by the sheer number of requests. Sure, strategic dashboards are great for monitoring KPIs and filtering the data. Still, real analysis requires munging the numbers, combining different data sets, and iterating on the questions until you find the answers.

The current players in the Business Intelligence space mostly require SQL knowledge, lack collaboration, and make it difficult to find what you’re looking for in a sea of dashboards. These tools are primarily built by data people for data people. So naturally, they are excellent at accomplishing the jobs to be done for data teams, like answering complex questions with SQL, Python, and R.
However, when it comes to meeting the needs of business teams, these tools feel more like coloring books than real analytical tools. The result is a set of head-scratching decision paths all leading back to offline spreadsheets:
- “Here’s a chart with some filters, have at it. If you need to drill into the data, just export it to sheets.”
- “We can’t trust you with joining data, but feel free to export to sheets and write a V-LOOKUP yourself anyways.”
- “We care about governance, so we’ll centralize your sheets and rebuild them as a dashboard, but please try to avoid exporting customer data back to sheets.”
If business teams don’t want to export to sheets, they’re left to either ask a question in a #askanalytics channel or *deep breath* submit a ticket. Business teams can be left wondering how long it will take to answer, who can answer it, and if that person even understands the request. Data teams have probably answered the same question a dozen times before or don’t have enough information to answer the question correctly. Even if you get to the correct initial answer, there are almost always follow-up questions.
“Business Intelligence is a solved problem.”
My experience at Flexport led to starting Canvas, a collaborative data exploration tool for business teams to answer their questions without SQL.
By meeting business teams where they feel comfortable via a familiar spreadsheet-like interface, they can use Canvas to filter, pivot, visualize, and build formulas using live data. Canvas generates every spreadsheet action as SQL that runs on the most popular warehouses and integrates with dbt to put metadata in the hands of business teams. When business teams have inevitable questions about the data, Canvas makes it easy to collaborate and work remotely via a multi-player canvas, similar to popular tools like Figma and Miro.
When we pitched Canvas to investors, we got a lot of blank faces. Many data experts look at BI as a solved problem with massive players dominating the market over the past decade. But to us, this felt a lot like saying that WebEx and others solved video conferencing before Zoom changed how and where the world worked.
The arc of the modern data stack is bending towards modular tools responsible for different jobs to be done. There’s a Cambrian explosion happening of dashboards, notebooks, catalogs, metrics, syncs, streams, dumps, dictionaries, reports, alerts, and pipelines. Gone are the days of an all-in-one BI tool stretched thin by dozens of features and use cases.
While many startups are focused on building the next tool for data teams, we’re so excited to focus on building a data tool that business teams will finally love to use. Because “non-technical” teams should never feel the anxiety I felt in my early days as a PM staring at SQL.
If you’re interested, you can sign up for free or shoot me an email at ryan@canvasapp.com.
