Copilot
We're releasing a preview of our AI copilot!
As with everything, we're building it in public, so you can read more about how it works here.
Improvements
- Break Copilot SQL generation into stages
- Make debugging SQL easier in Copilot
- Add area charts
- Refine syncing UI
- Improve Segment model build times
- Improve model building performance
- Disambiguate case-insensitive column names in BigQuery
- Fix BigQuery pivot columns when one of the columns is an empty string
- Fix view sources shortcut
- Fix spreadsheet borders
Fix it May
We've made a ton of little fixes and improvements post-2.0 launch.
Templates
- Improve model building performance
- Improve pre-requisite auto-detection
- Build Intercom, Zendesk, Hubspot, Google Analytics, Google Ads, Salesforce, Shopify, Marketo, and Outreach models conditionally
- Fix Segment issue
Improvements
- Add autocomplete for text formulas
- Allow arrow key navigation and scrollbars for spreadsheets
- Make text line heights more readable
- Revamp viewing sources
- Align numbers tabularly
- Allow model and uploaded spreadsheet deletion
- Improve column width auto-detection
- Improve syntax for ephemeral spreadsheet uploads
- Improve spreadsheet performance
- Improve overall performance
- Improve latency for initial syncs
- Improve resilience against infra dependency
- Bring back row counts
- Fix issue with chart downloads
BigQuery
- Fix pivot rows
- Fix week aggregation
- Fix escaping
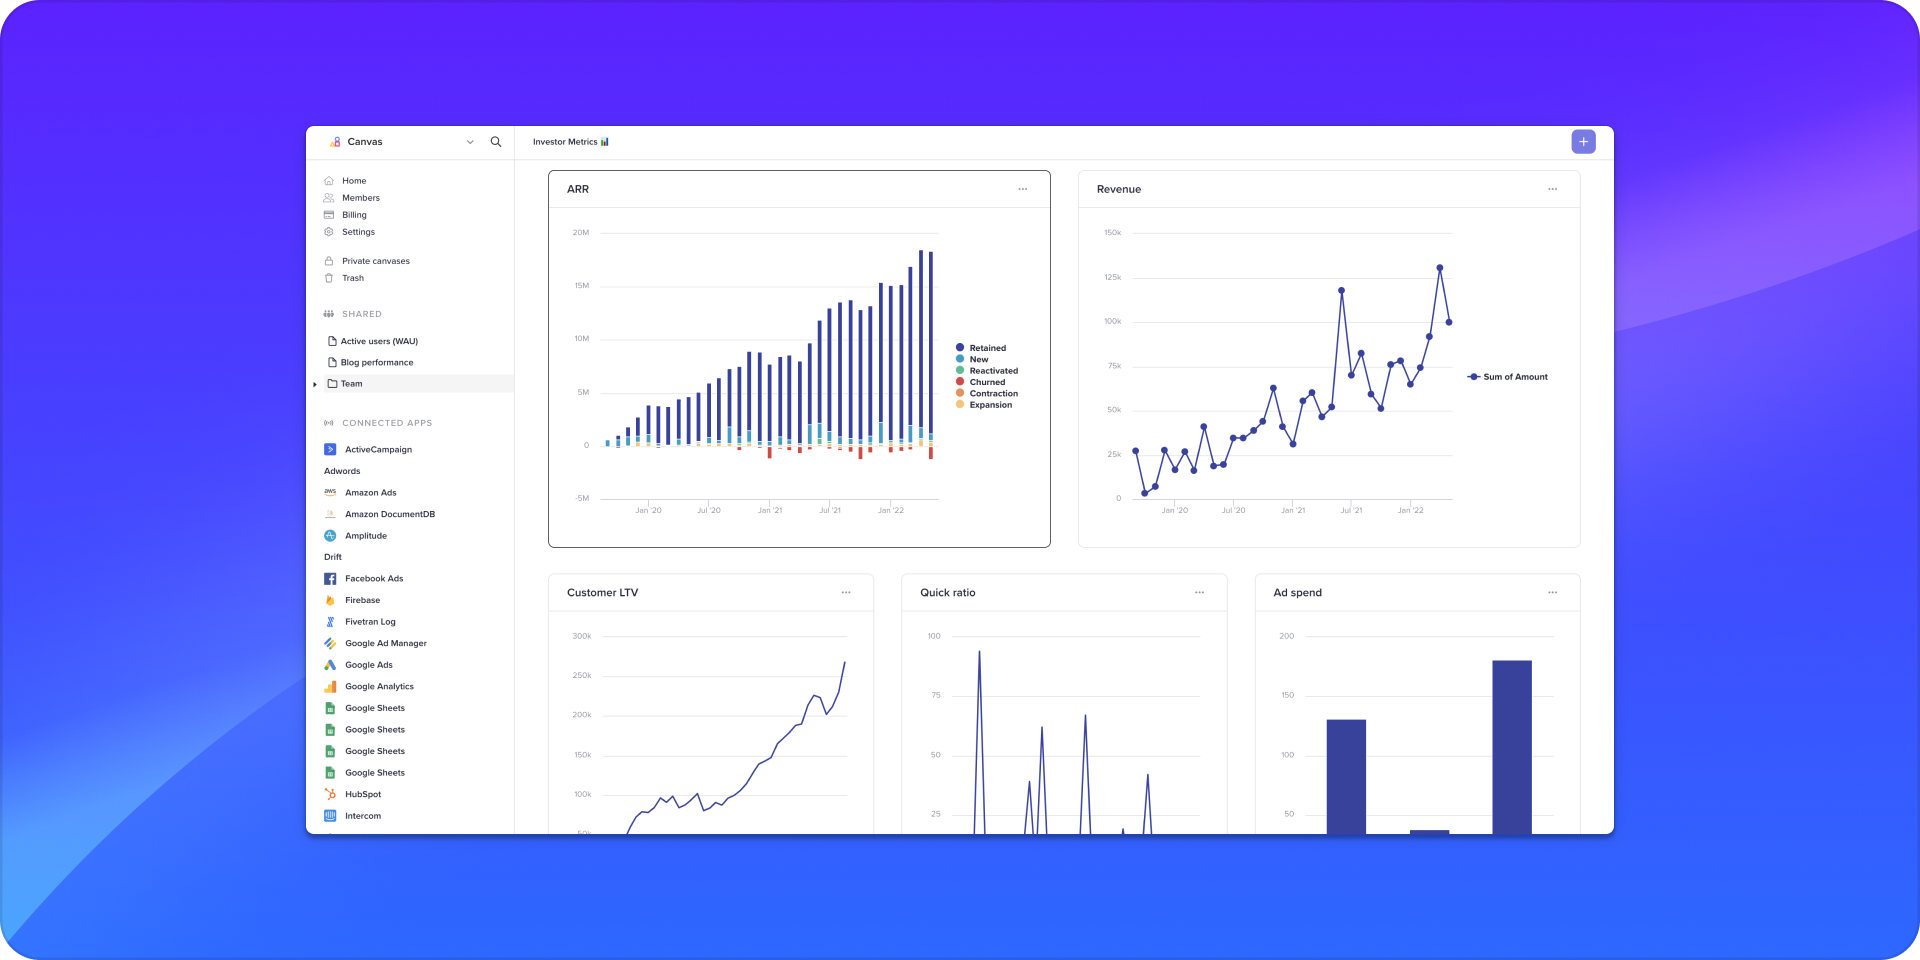
Canvas 2.0
The product got a huge upgrade today. The biggest and much requested change is a new core canvas experience with more control over element positioning.
Because it is such a radical upgrade, we decided to let you upgrade to the new UX at your own pace. You can go back to 1.0 if necessary, but we really hope you'll love the new canvas.
The visual side of both the app and the marketing site is also completely redesigned from the ground up. Charts got a whole new look as well.
Finally, the new architecture is much more performant. Canvas load times can often be over 10x what they were before.
Improvements
- New UX for adding elements to a canvas, which should help with discovering all the different tiny features we have
- Team canvases can now be grouped by category
- First-class mobile support
- Database names are now optional in many generated SQL queries (for prettier SQL queries)
- Allow numbers in "one of multiple" filters
Performance
This month we spent time improving performance across the board.
Improvements
- Add Firebase connector
- Improve dependent table handling
- Improve query streaming performance
- Improve initial load times
- Parallelize some tasks for improved performance
- Allow viewing
dbt docsruns - Allow two pivot case when statements
- Fix pivot table ordering
- Fix CSV upload for tables that start with a number
BigQuery February
We've made a few smaller improvements this month, particularly to our BigQuery integration, the SQL editor, and CSV download/upload.
Improvements
- Support column metadata in BigQuery
- Better dbt integration support for BigQuery
- Add a warning in BigQuery if connected user has no tables
- Support JSON operator, timezone syntax, lateral flattens, and date parts in SQL editor
- Allow pivots and joins directly from a source
- Allow viewers to download CSVs
- Use renamed column names in CSV downloads
- Improve CSV uploads
- Allow CSV replacing
- Improve initial setup
- Allow formatting of second y-axis
- Optimize syncing
- Infrastructure improvements
- Memory efficiency improvements
- Support delete key in addition to backspace
- Handle Quickbooks accounts without bills
- Fix blanks in spreadsheets while scrolling
- Don't show hidden columns in chart menu
- Better support for Unicode
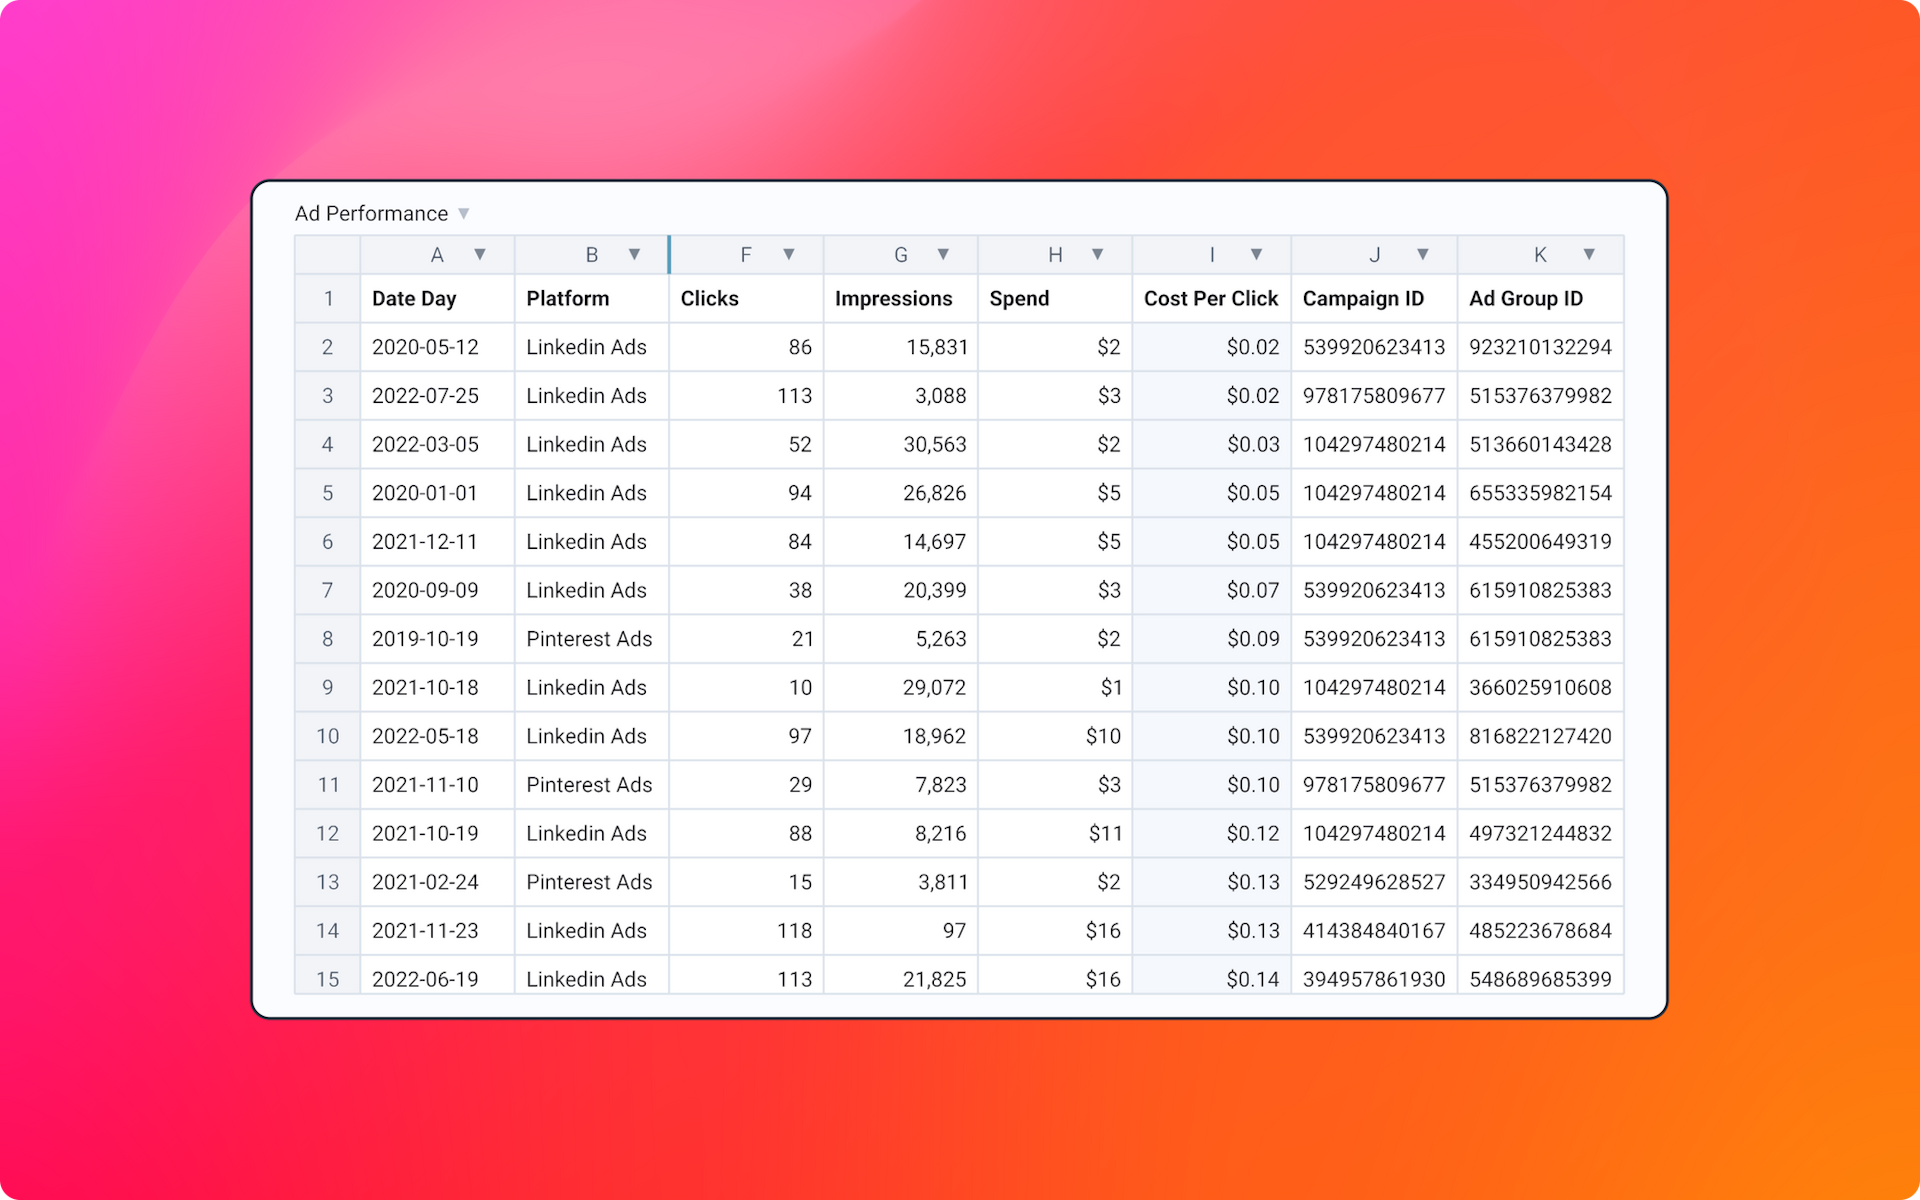
Humanize
You can now rename columns in all tables, including joins and pivots. All column names are now also humanized by default, e.g. Cost Per Click where COST_PER_CLICK once was. 
New functions
- NUMBERVALUE for converting values to numbers
Improvements
- Date filters are now inclusive by default
- Added sub-organization management
- Added magic link login
- Added scrollbars
- Improved viewer-only UI
- Improved CSV downloads
- Improved chart performance
- Improved SQL editor
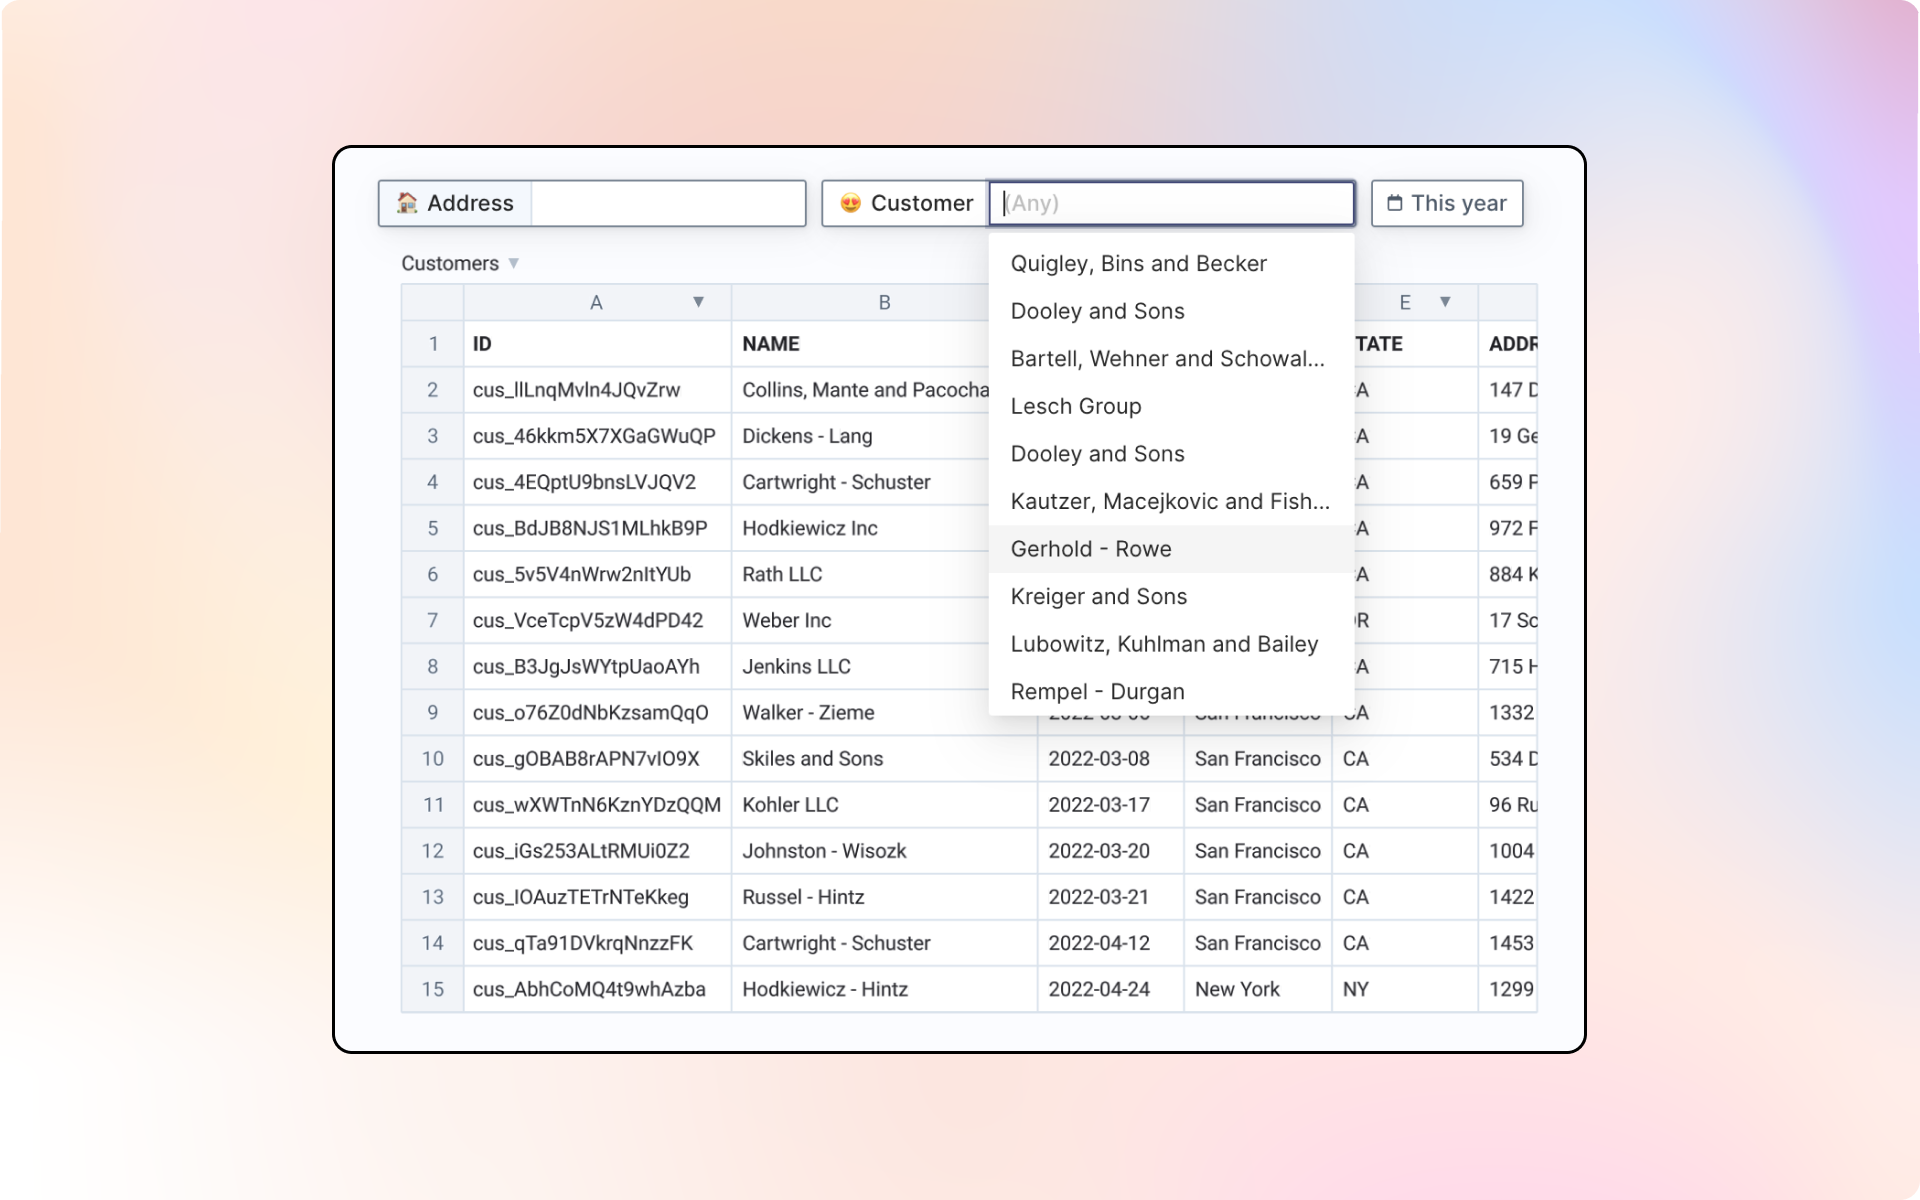
Filters
We added date, multi-select and search filters you can add to your canvases to make it easier for yourself and others on your team filter every table, pivot, and chart without having to filter individual tables.
Improvements
- Hidden columns now get removed from downloaded CSVs as well
- Added slugs to canvas links
- Added the ability to create new organizations manually
- Added backticks to formulas
- Allow formulas in cloned tables
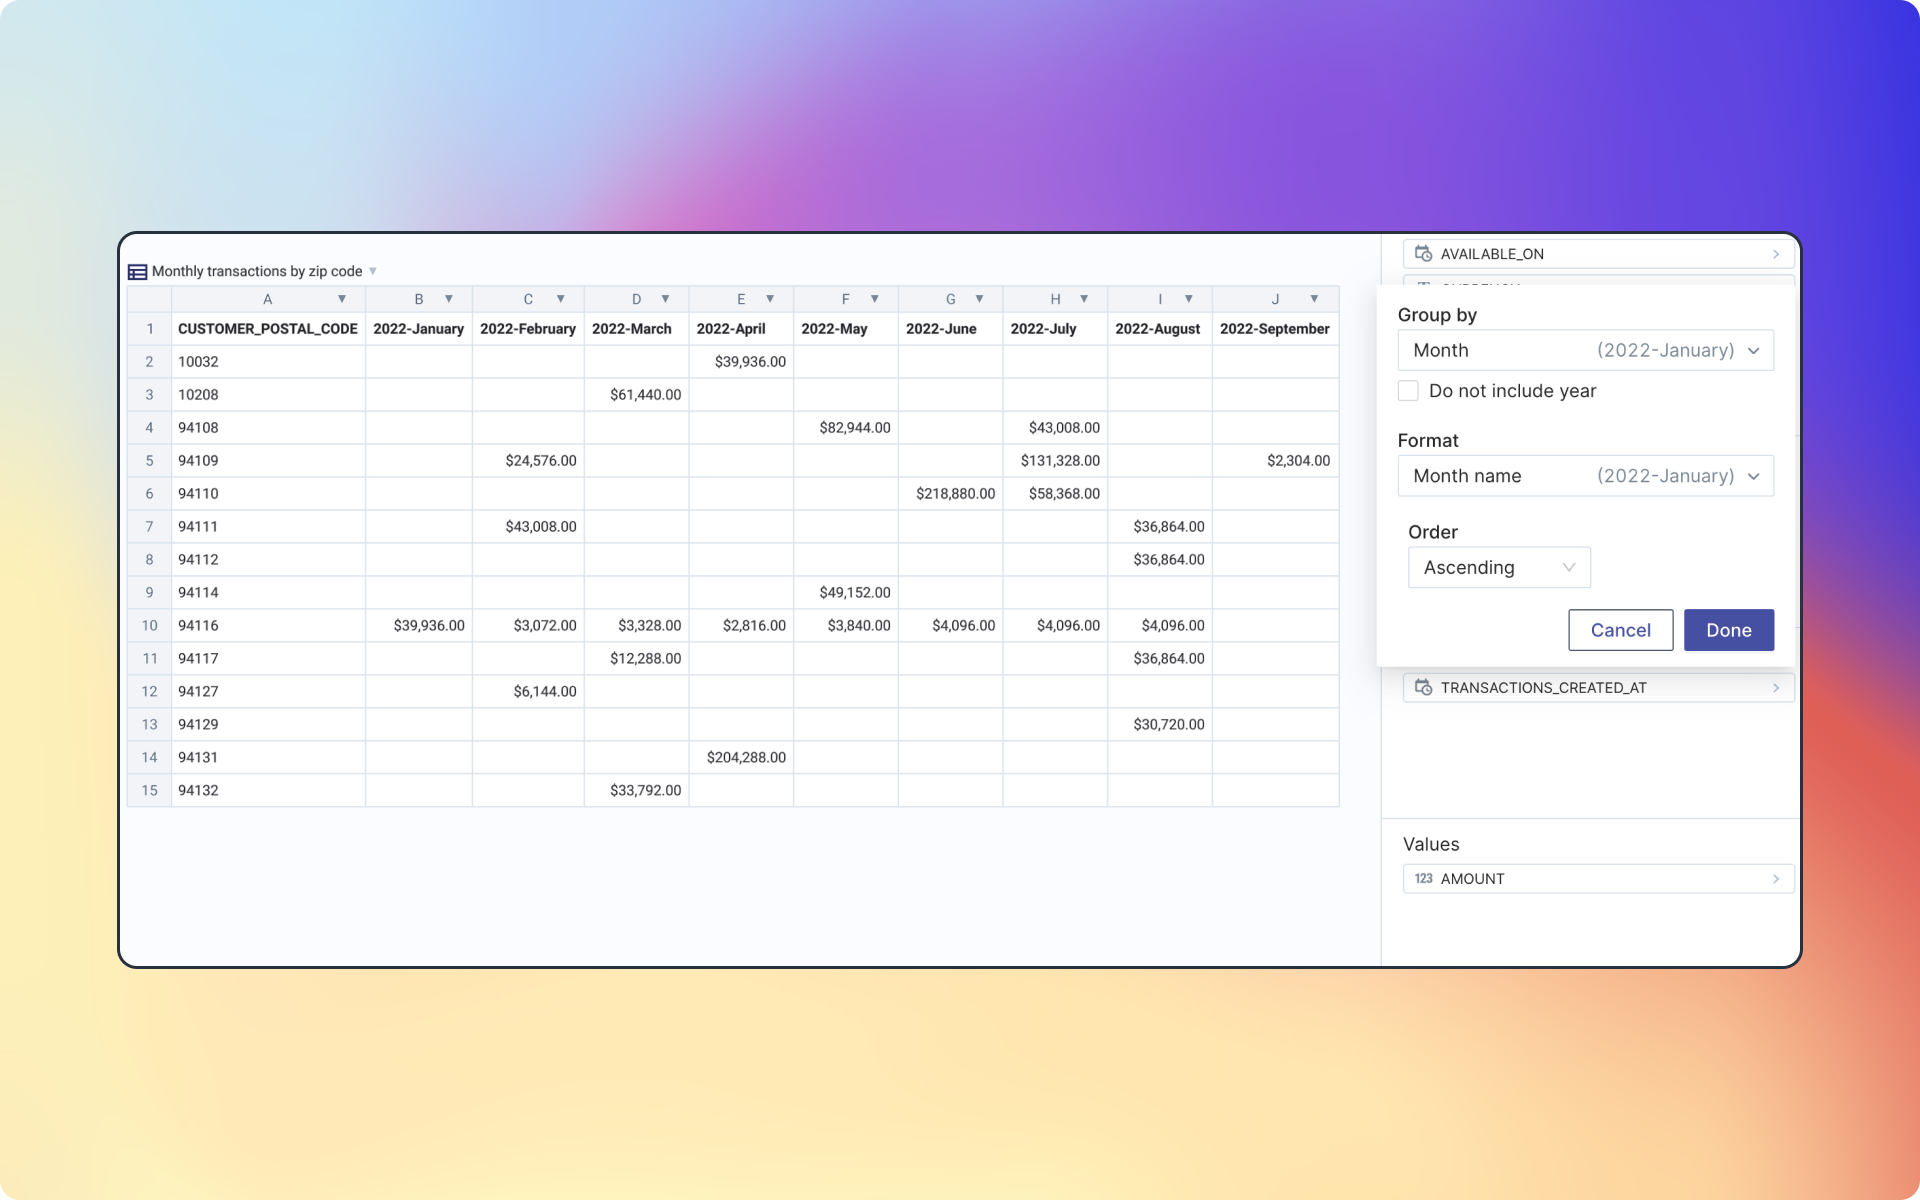
Column aggregations
You can now aggregate dates in pivot columns instead of just dates. Especially useful for financial models (e.g., P&Ls).
New functions
- DATEADD for adding intervals to date values
Improvements
- Added the ability to pivot pivots
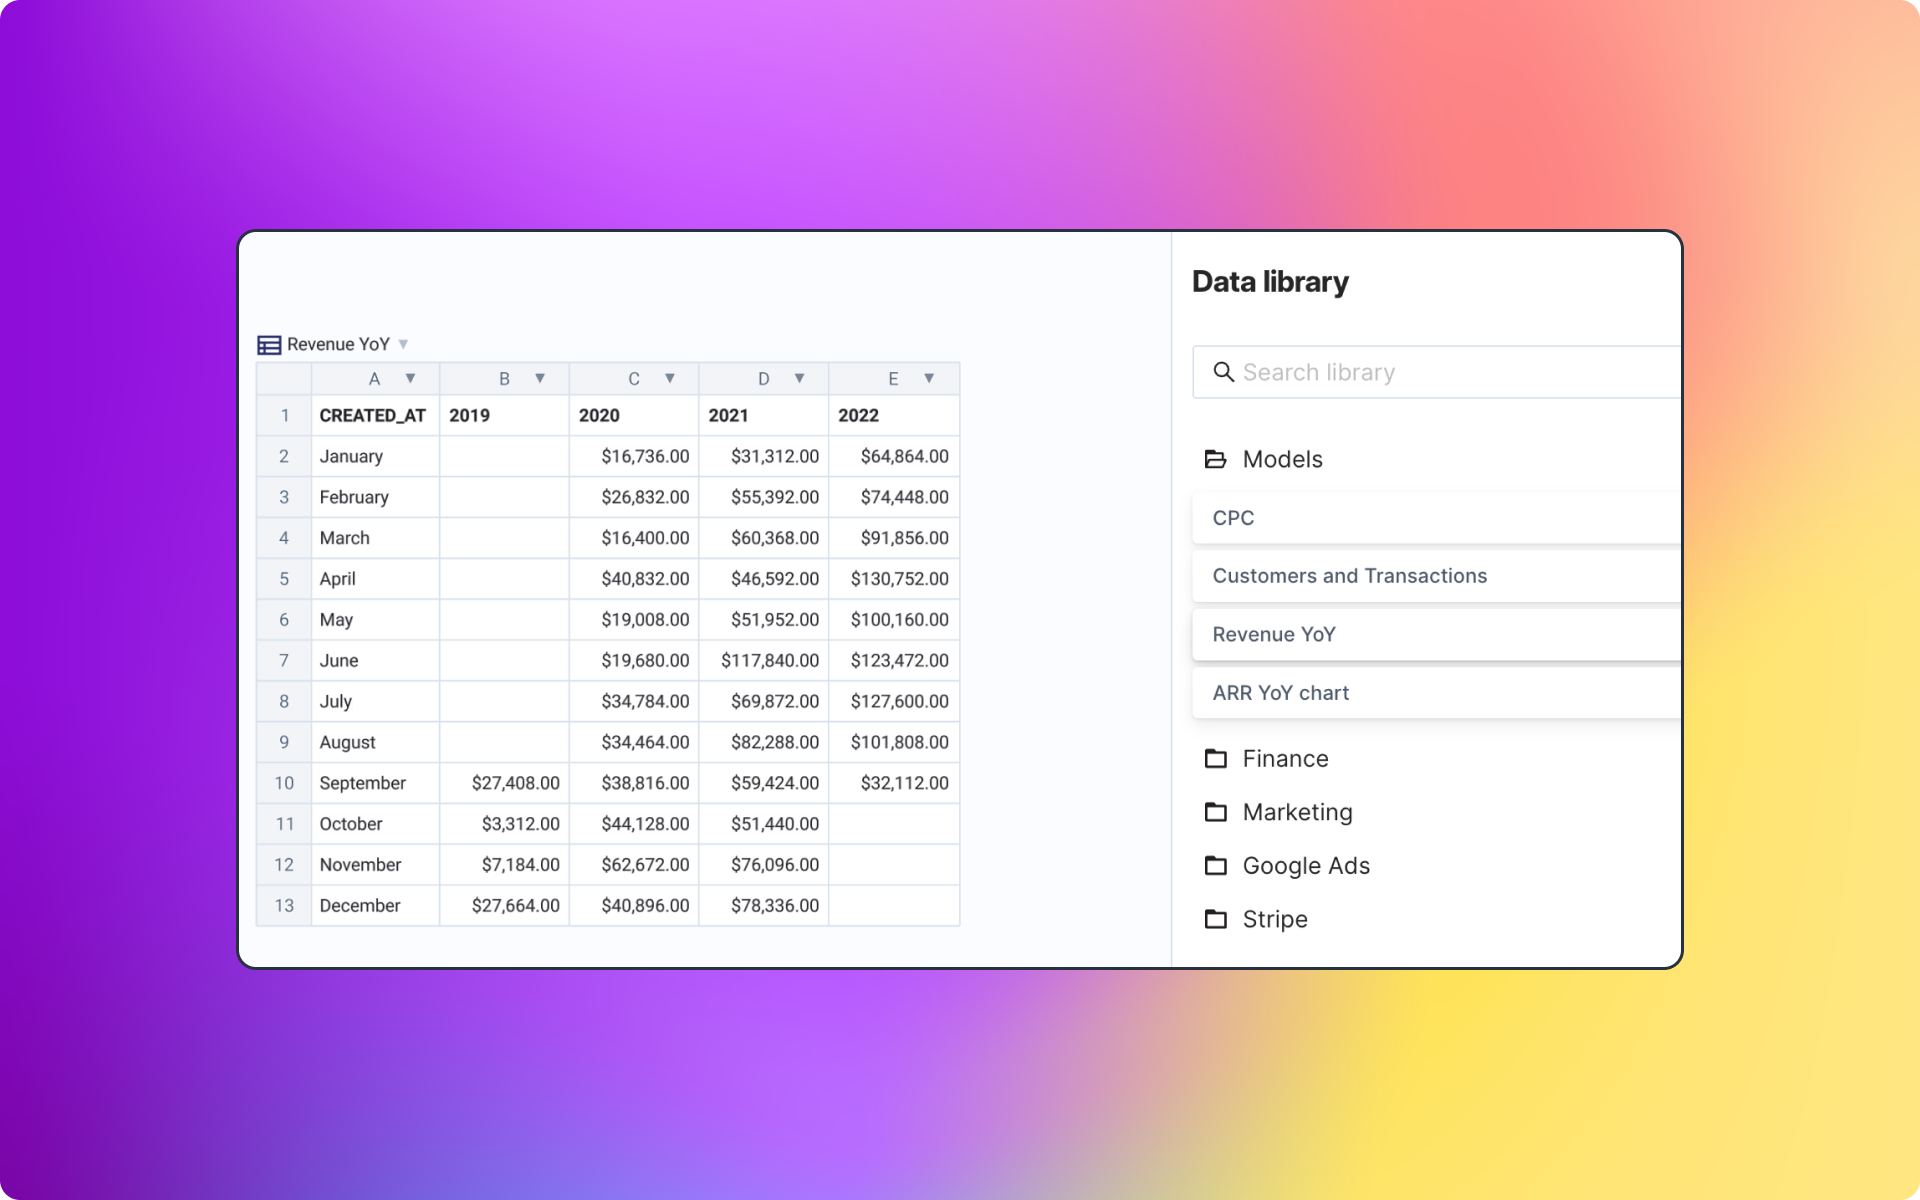
Models
You can now save your complex tables as reusable models for the rest of your team.
For example, if you enriched a table with a series of complicated joins and pivots, you can now save that and reuse it instead of recreating it every time.
Improvements
- Added the ability to show numbers directly on bars in bar charts
- Added chart empty states
- Added the ability to restore deleted canvases for a short time
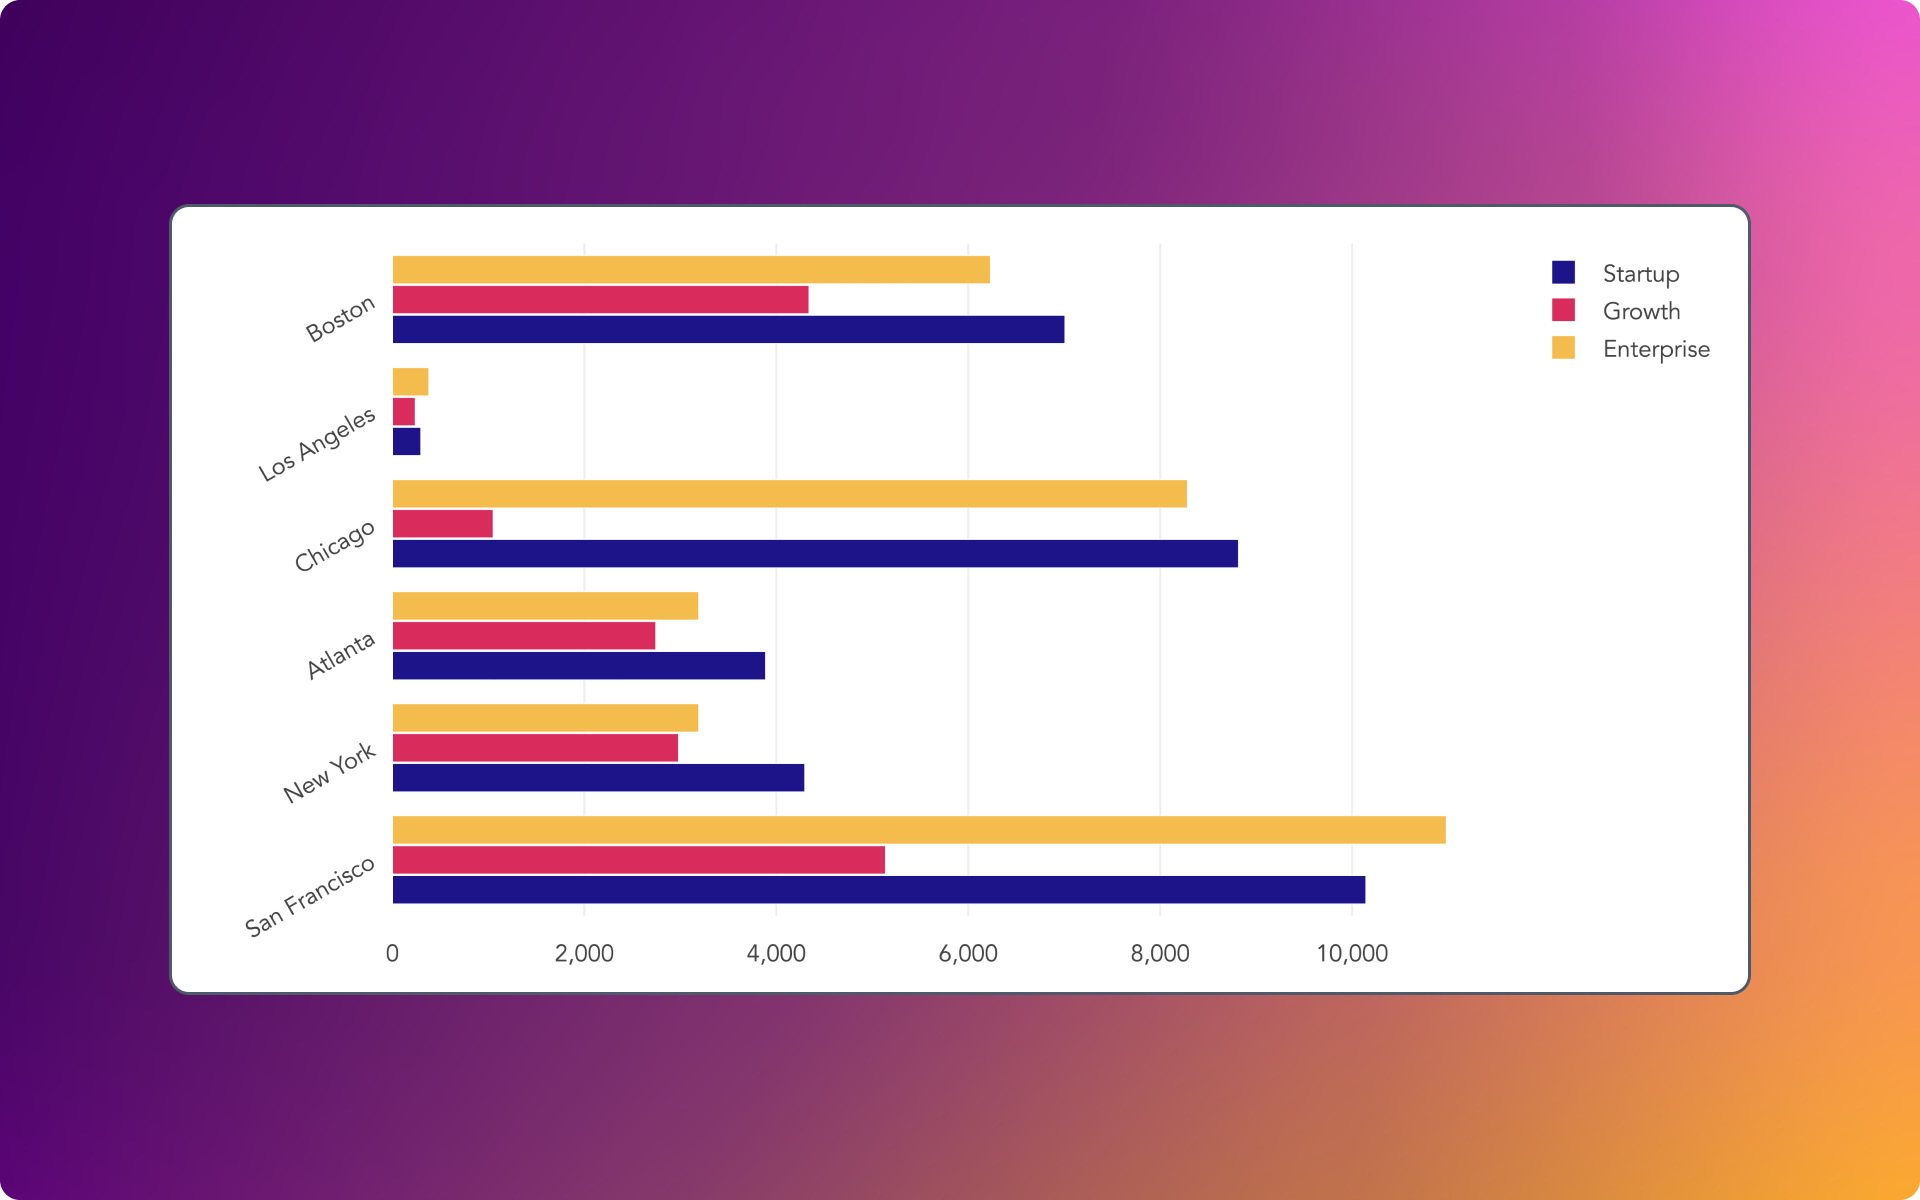
Horizontal bar charts
We added horizontal bar charts, as well as the ability to toggle bar totals on all bar chart types.
We also now support Okta SSO and magic links!
Improvements
- Added the ability to move columns in joins
- Added medians in Snowflake and Redshift
- The sidebar is now automatically closed in a new window (instead of open)
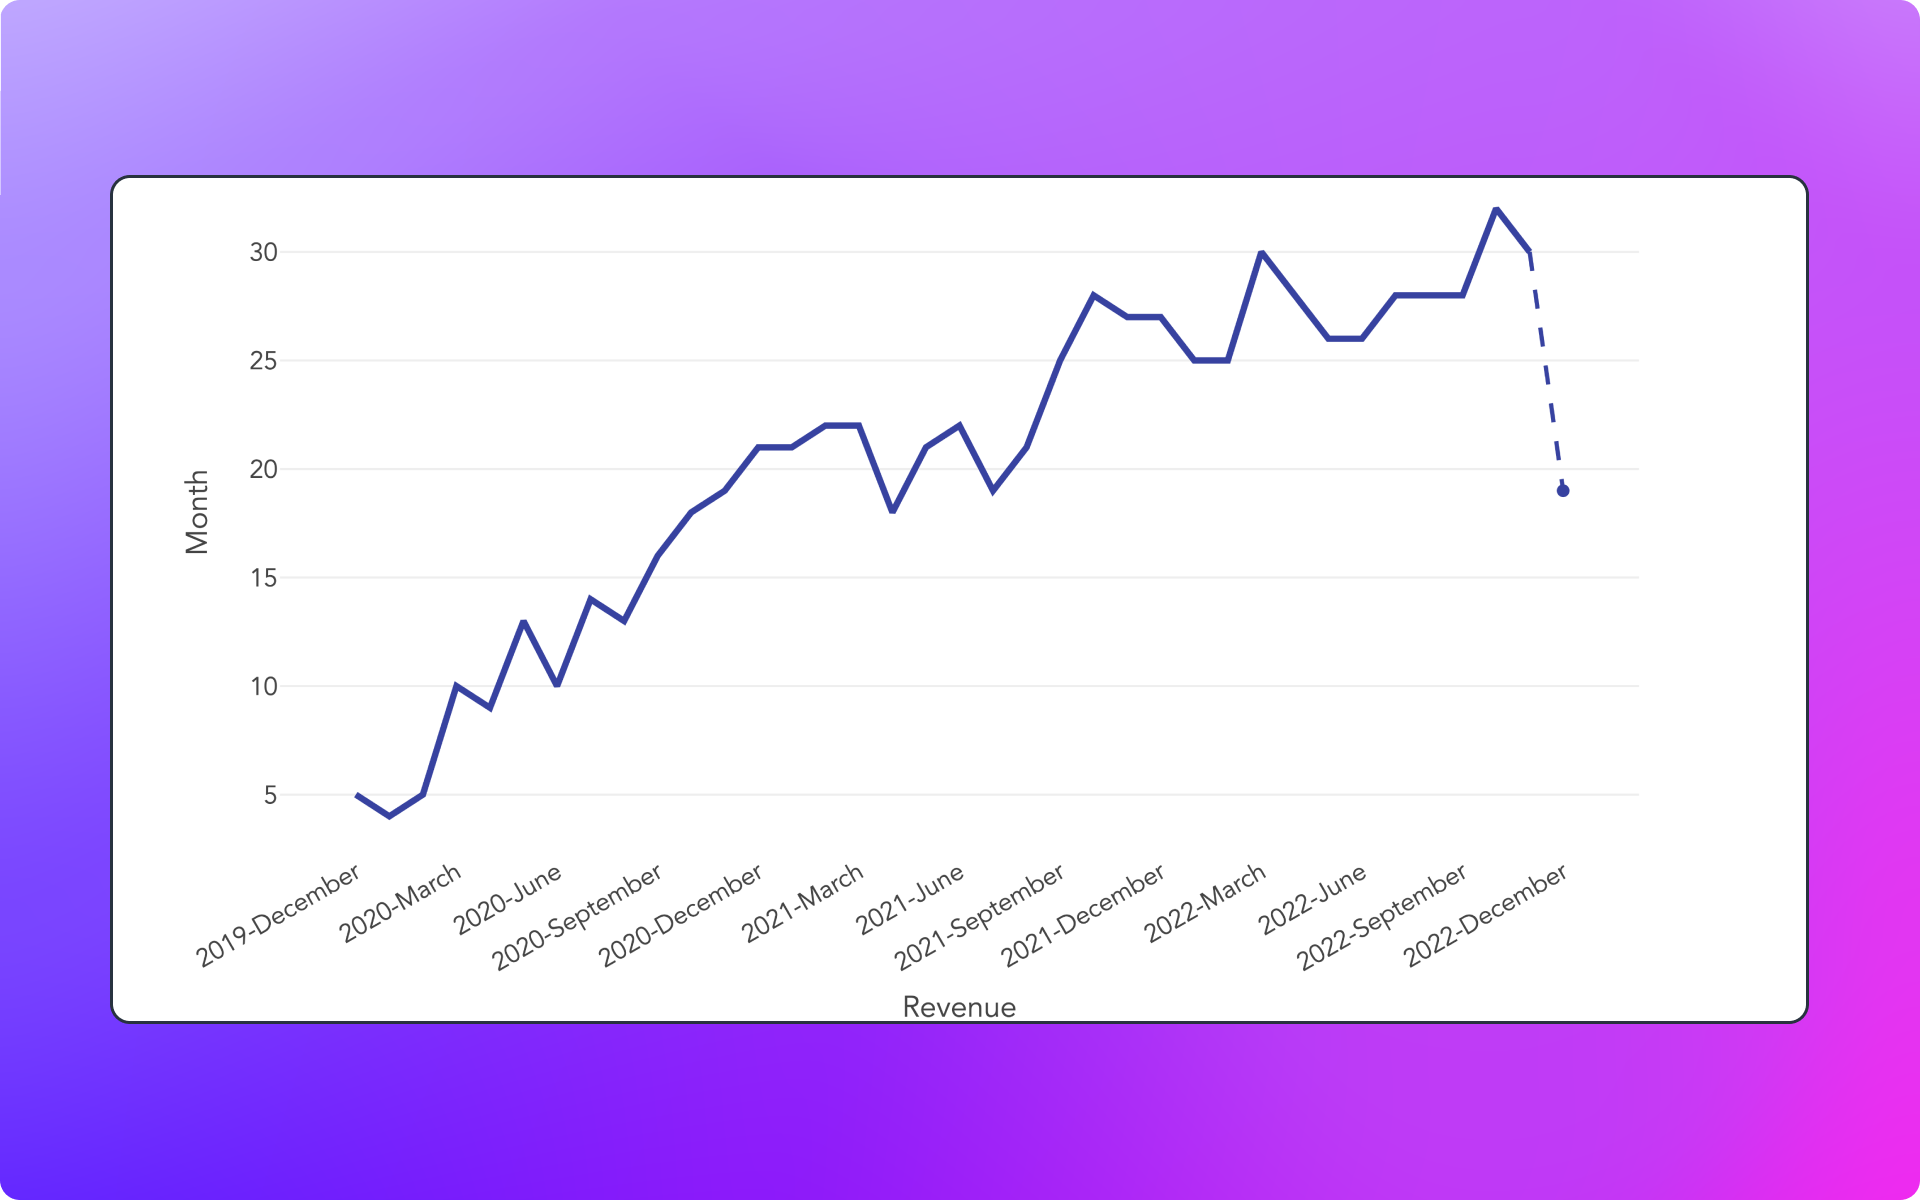
Incomplete data
This might be familiar: a new month rolls in and you get a pit in your stomach. The numbers went down significantly. You look a bit deeper and it turns out they didn't; it's just that the data for this new month is incomplete.
To make this situation clearer, we added some affordance to charts with time-series data for an incomplete month.
Improvements
- Added the ability to partition values in LEAD and LAG functions
- Improved animation performance
Color themes
Added new color themes to choose from when designing charts. 🧑🎨 We also made many small changes to make colors more consistent across the board.
The SQL editor was also moved to the bottom and made resizable. Much more ergonomic this way!
New formulas
- SAFEDIV for safely dividing by values that might contain zeroes
Improvements
- Added clickable hyperlinks to canvas text
- Added right alignment for numbers in tables
- Added week number (W2) aggregation format to pivot tables
- Improved SQL editor performance
Resize charts freely
Charts can now be resized freely. You can make them as tall or wide as you wish, which adds a whole new level of freedom to dashboard design!
We also now support uploading CSVs directly to the warehouse as new tables.
New formulas
- EXTRACTJSON for extracting data out of JSON values
Improvements
- Added an in-app chat option for user help and feedback
- Made JSON display better in Postgres
- Improved handling for big ints in Postgres
- Improved chart legends
- Added undo and redo to the toolbar
Moving columns
You can now move columns around in columns! We'll update the query automatically.
You can also link to specific elements on a canvas now. When someone visits the link, the canvas will center on that element.
Improvements
- Added the ability to sort pivot columns
- Added a way to view all the objects on a canvas, including hidden ones
- Improvement canvas list performance
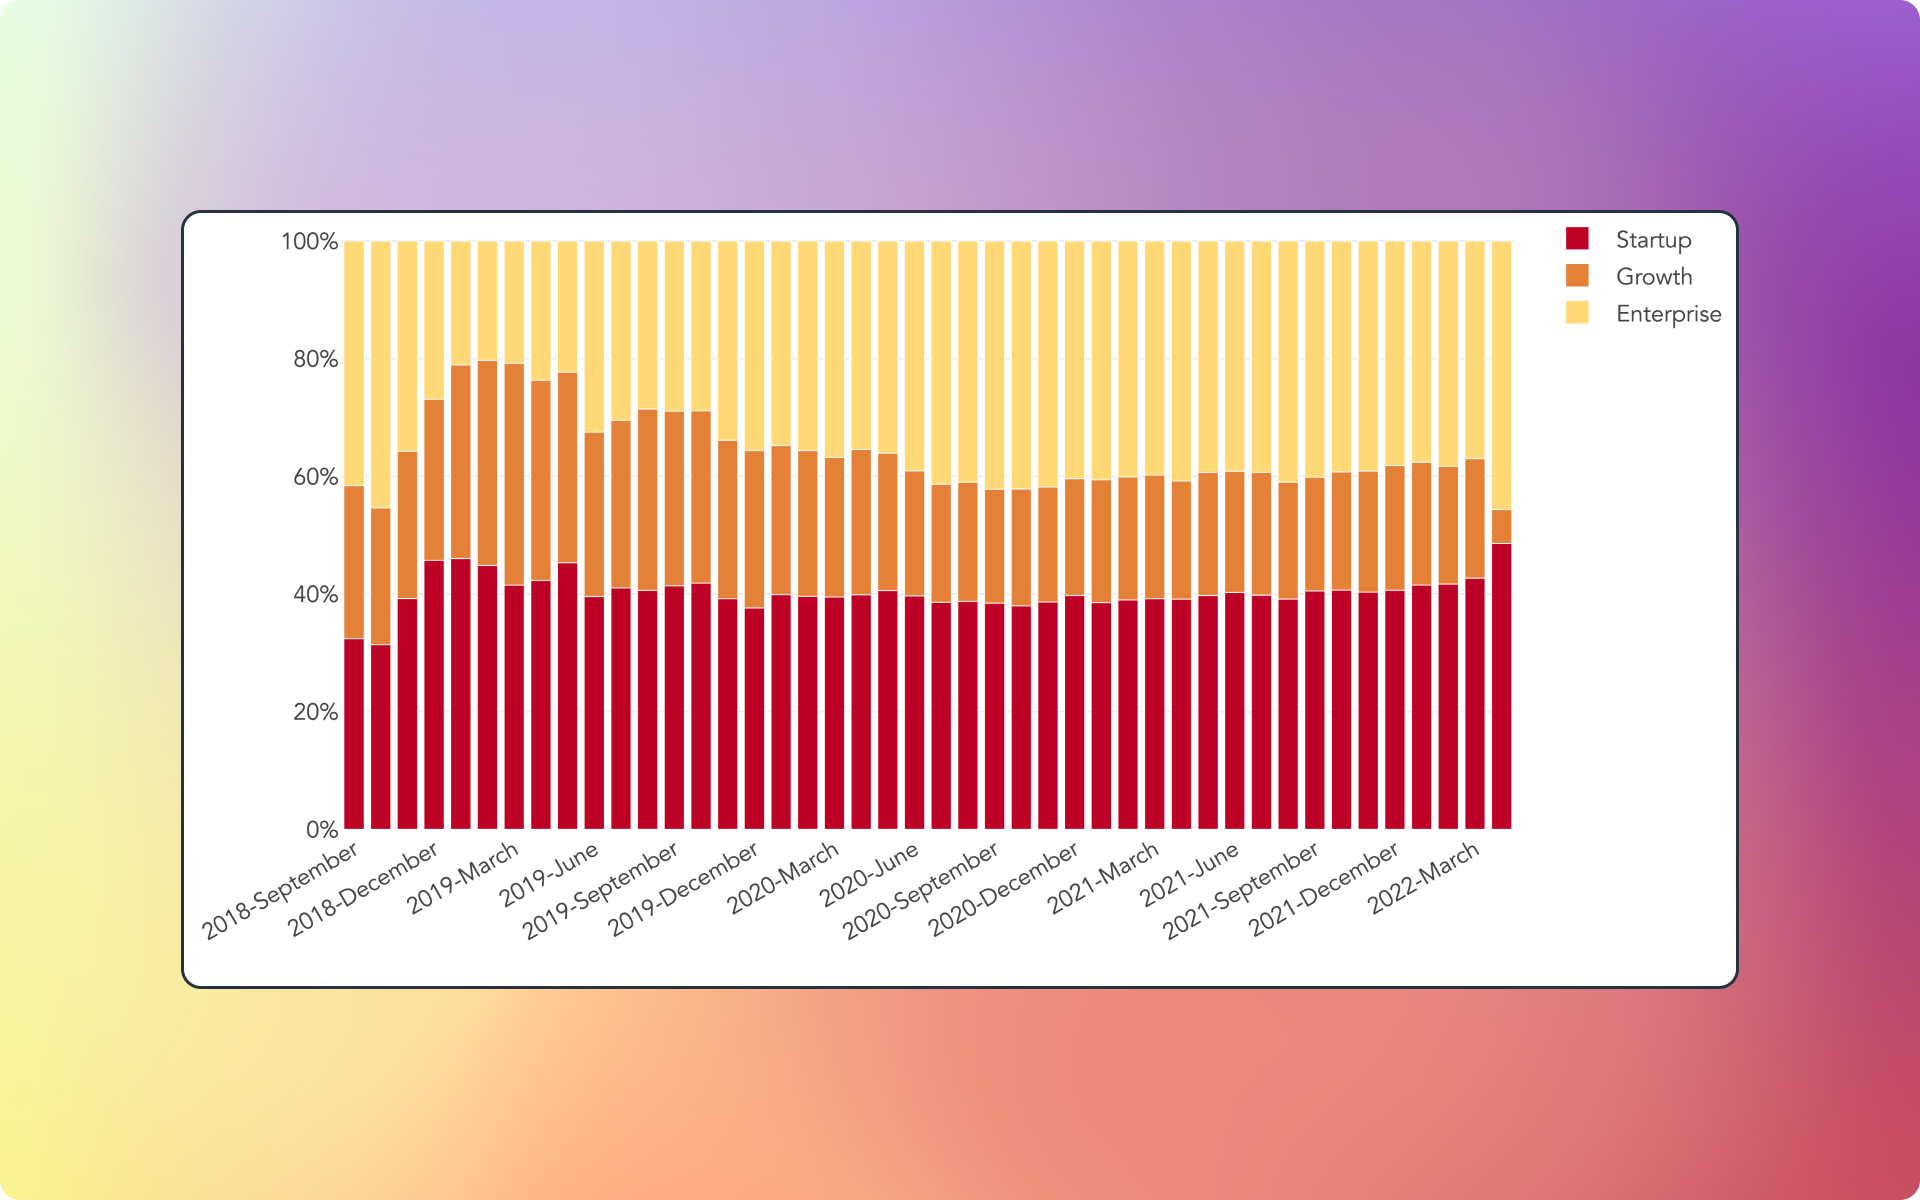
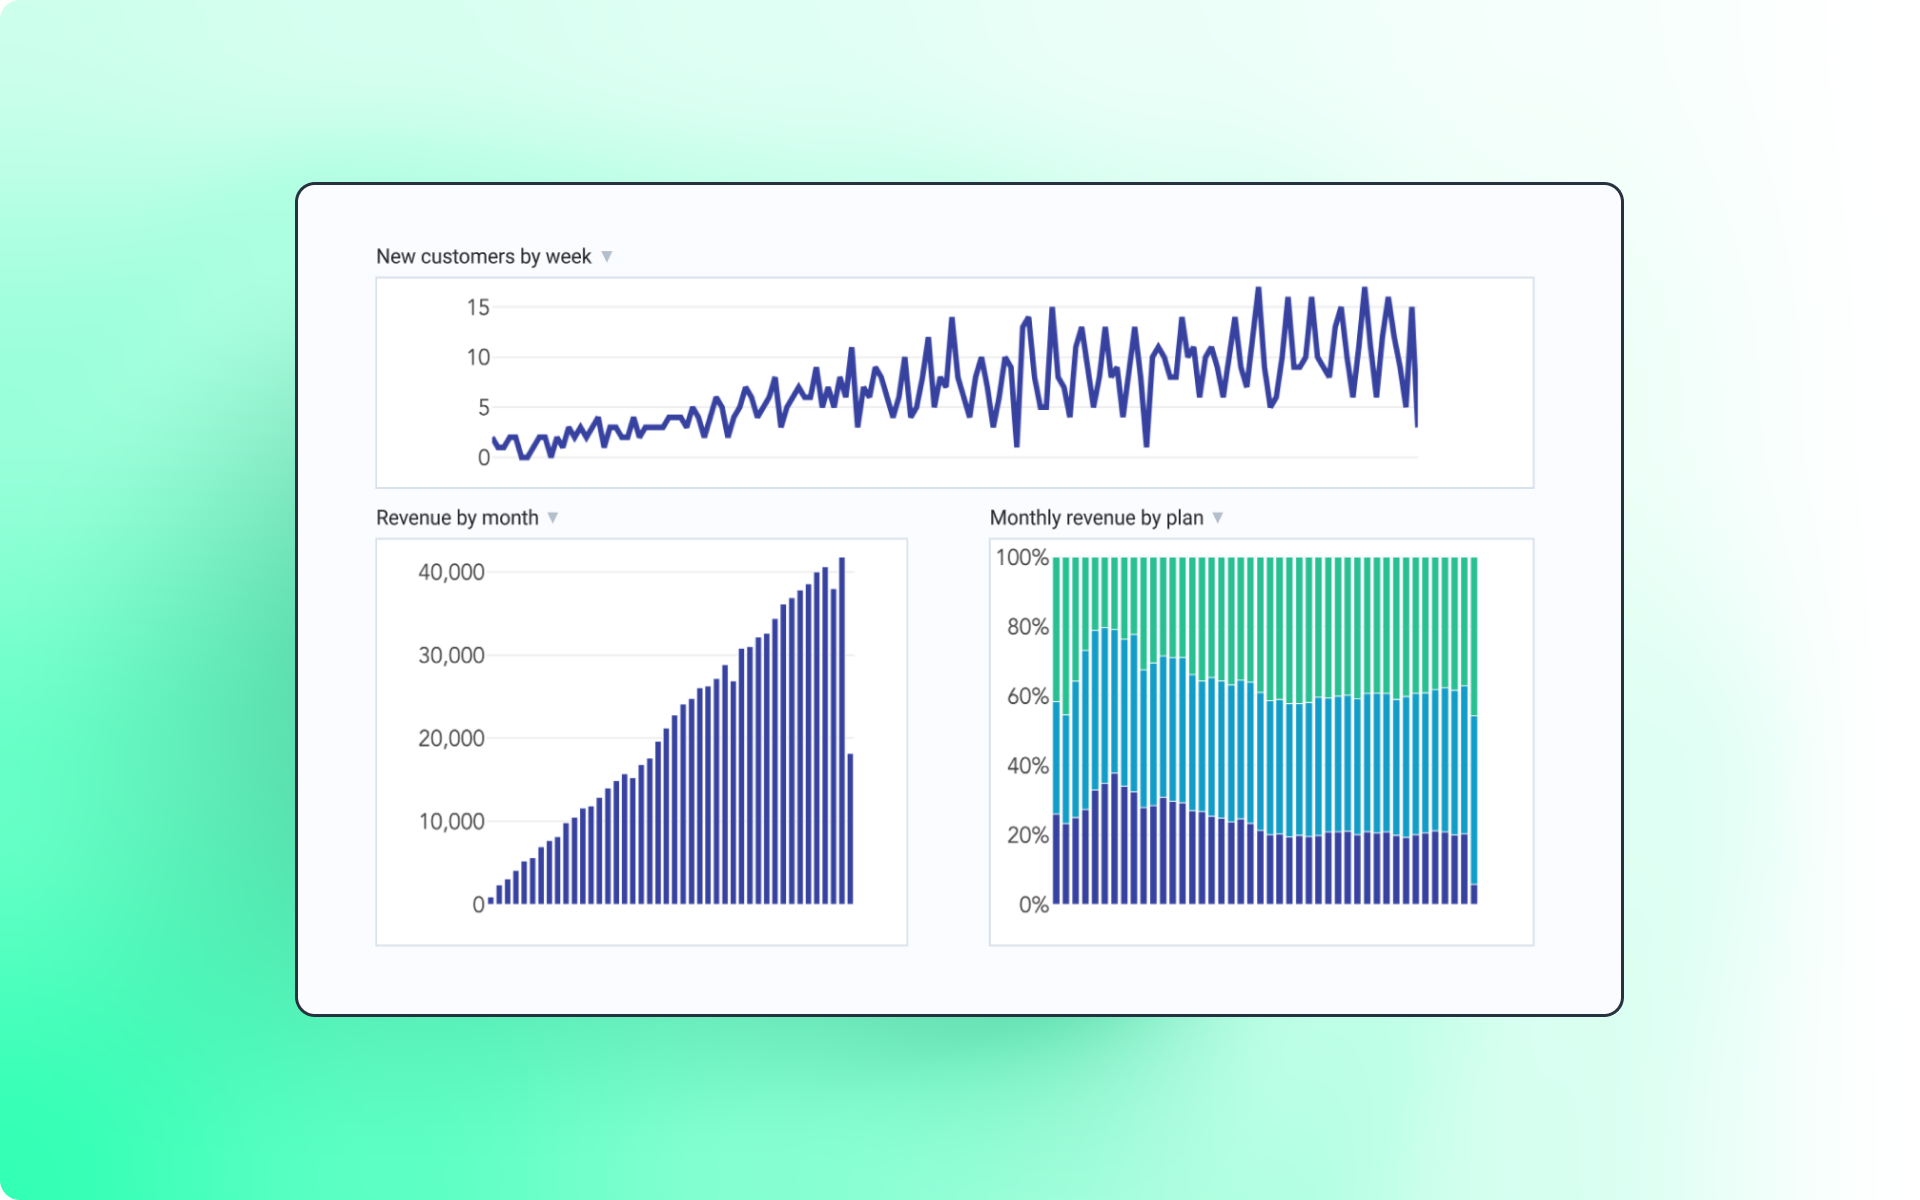
100% charts
Added support for bar charts scaled to 100%. They are especially useful for seeing how the distribution of values changes over time.
In design news, we switch the in-app font to Inter by Rasmus Andersson. We tried a lot of options, and Inter was the most suited for interfaces. Bye Avenir!
New functions
- REPLACE for replacing patterns within text
- LEAD and LAG for comparing values with neighboring (previous or subsequent) values
- SQL for easily dropping into SQL in formula columns
Improvements
- Added REPLACE function for replacing patterns within text
- Added LEAD and LAG functions for comparing values with neighboring (previous or subsequent) values
- Added SQL formula for easily dropping into SQL in formula columns
- Added the year-month number pivot aggregation format (e.g. 2022-07)
- Updated user badge colors
- Added the ability to replace a CSV with another one in-place
- Made warehouse errors less intrusive
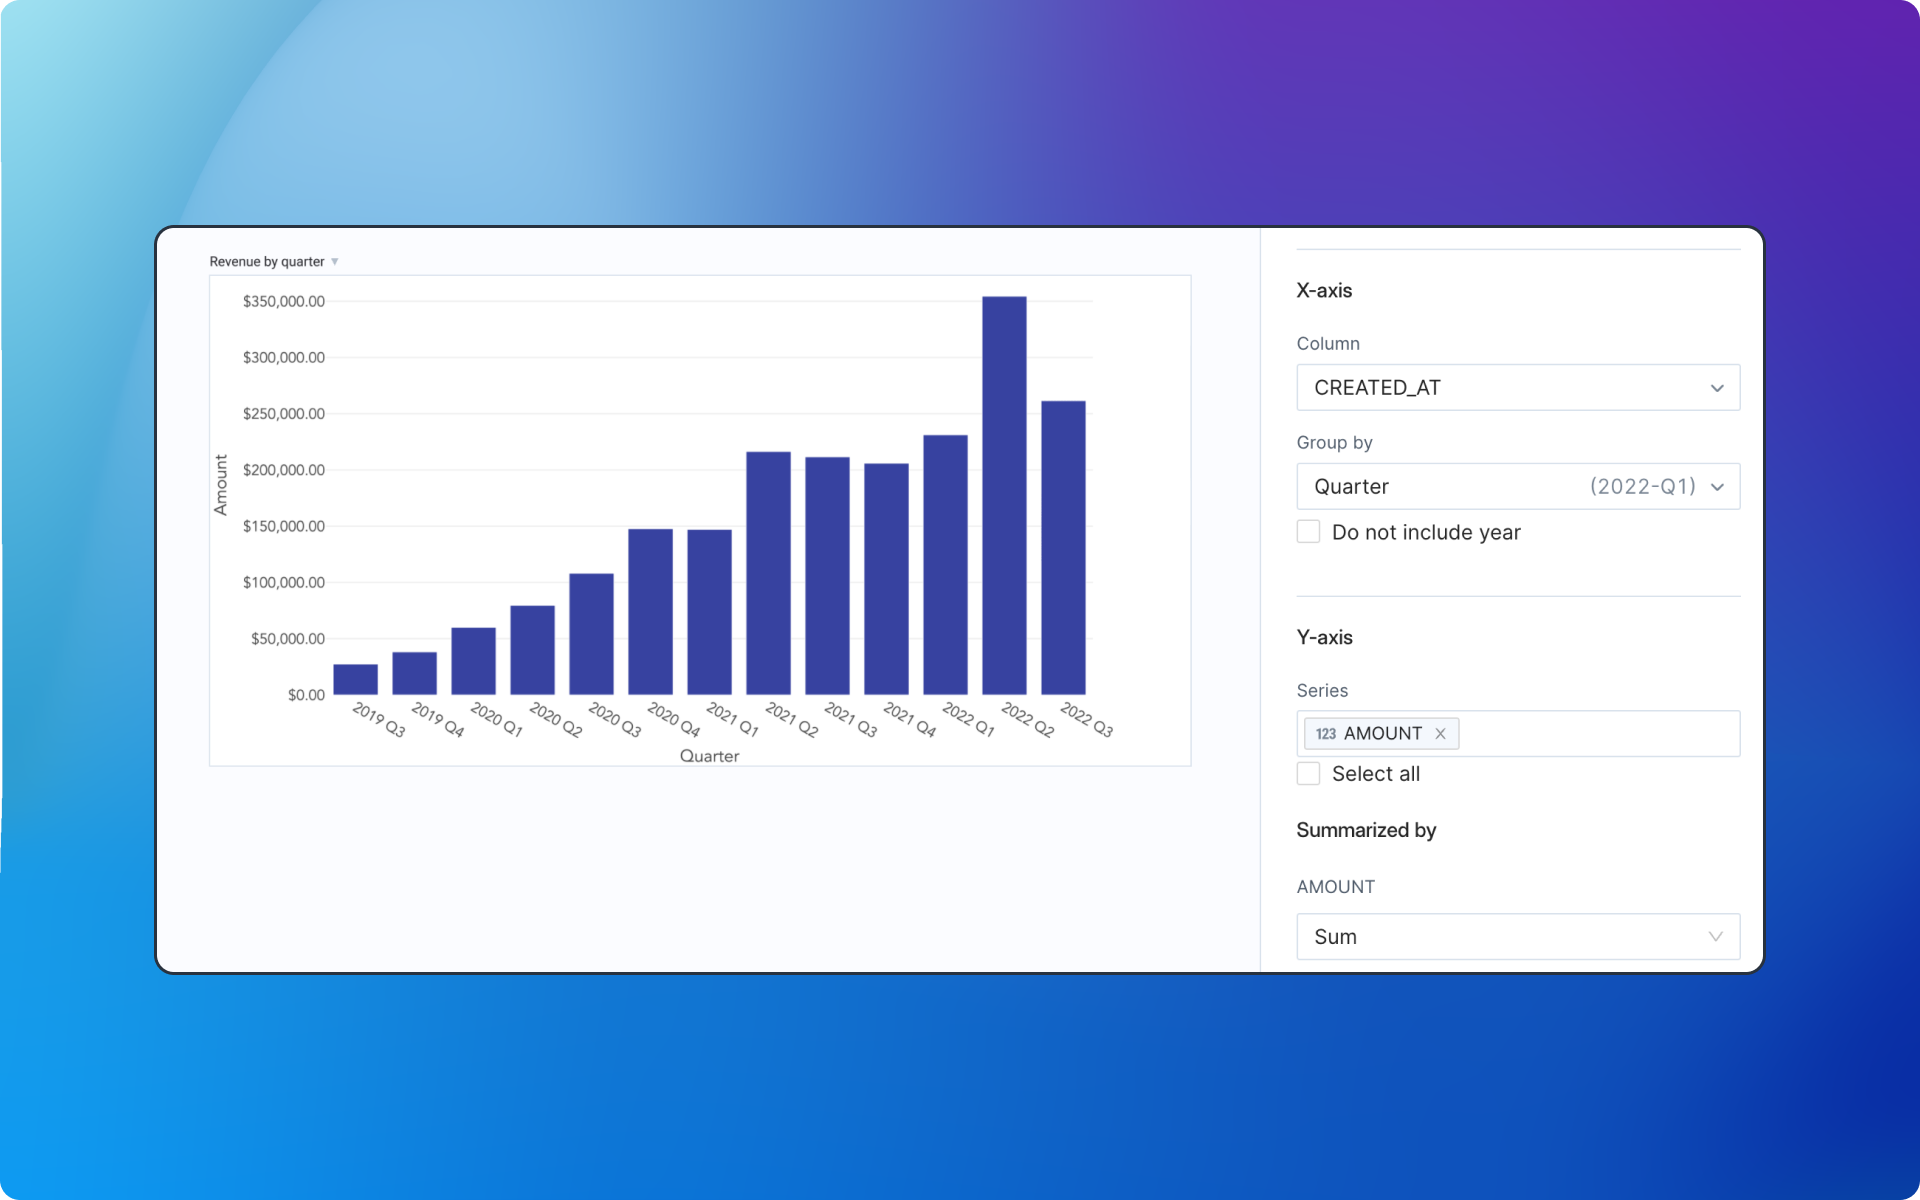
Chart aggregations
You can now aggregate dates directly while making a chart, without having first to create a pivot!
While we were at it, we also made it possible to create pivots and charts from scratch without starting with another table first.
Improvements
- Searching in the data library now searches columns as well
- Disambiguated truncated x-axis labels on charts that were previously hard to distinguish
- Added the ability to download an entire table to a CSV
- Added a tooltip for SQL errors
- Added support for external data sources in BigQuery
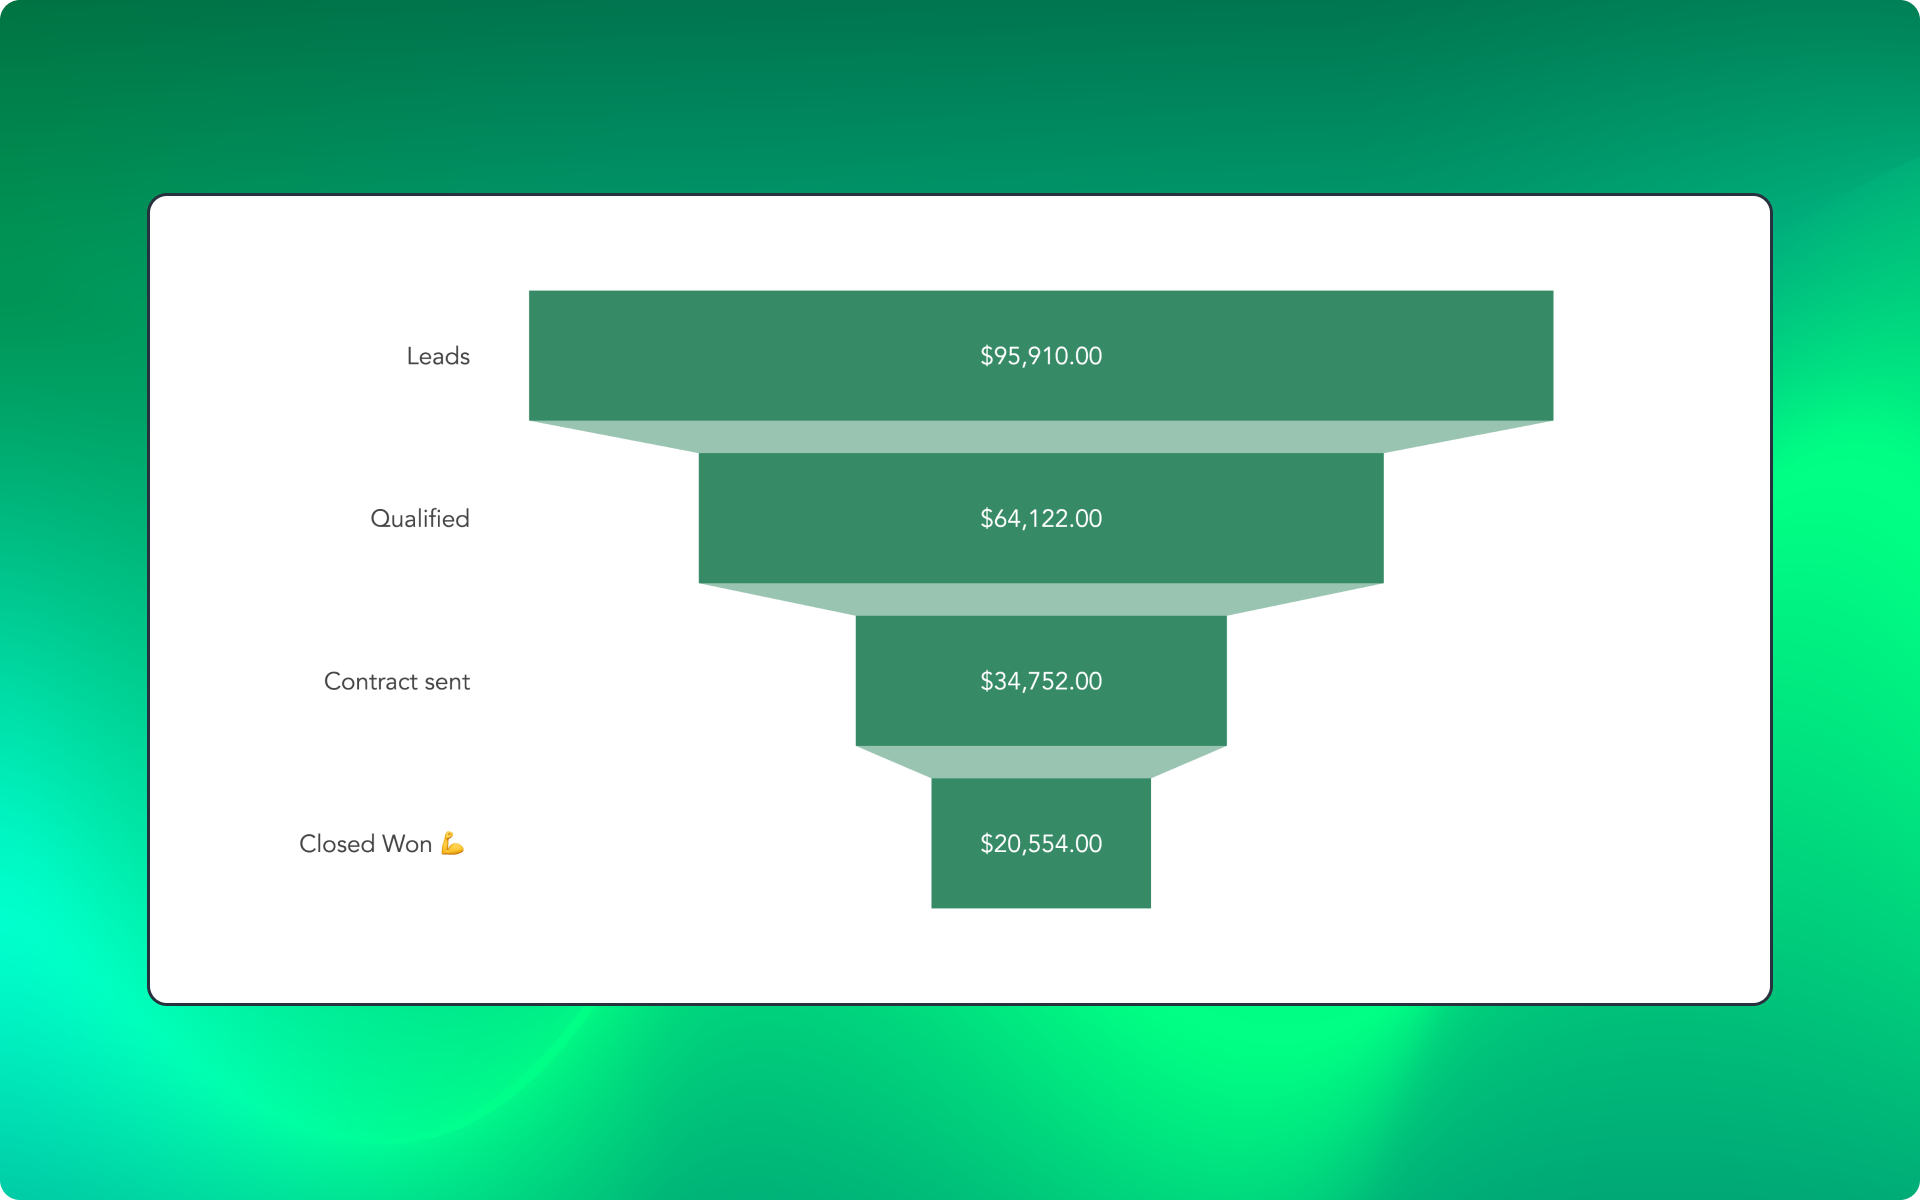
Funnel charts
Added a fun new chart type: funnels!
New formulas
- TEXTCONTAINS: check if a string contains a specific string
Improvements
- Simple pivot tables without rows or columns now allow formulas
- Added warehouse selection when creating a new canvas for customers with multiple warehouses
- Made query retries smarter
- Allow undo on text formatting
- Improved interval and date parsing in Postgres
- Improved error messages
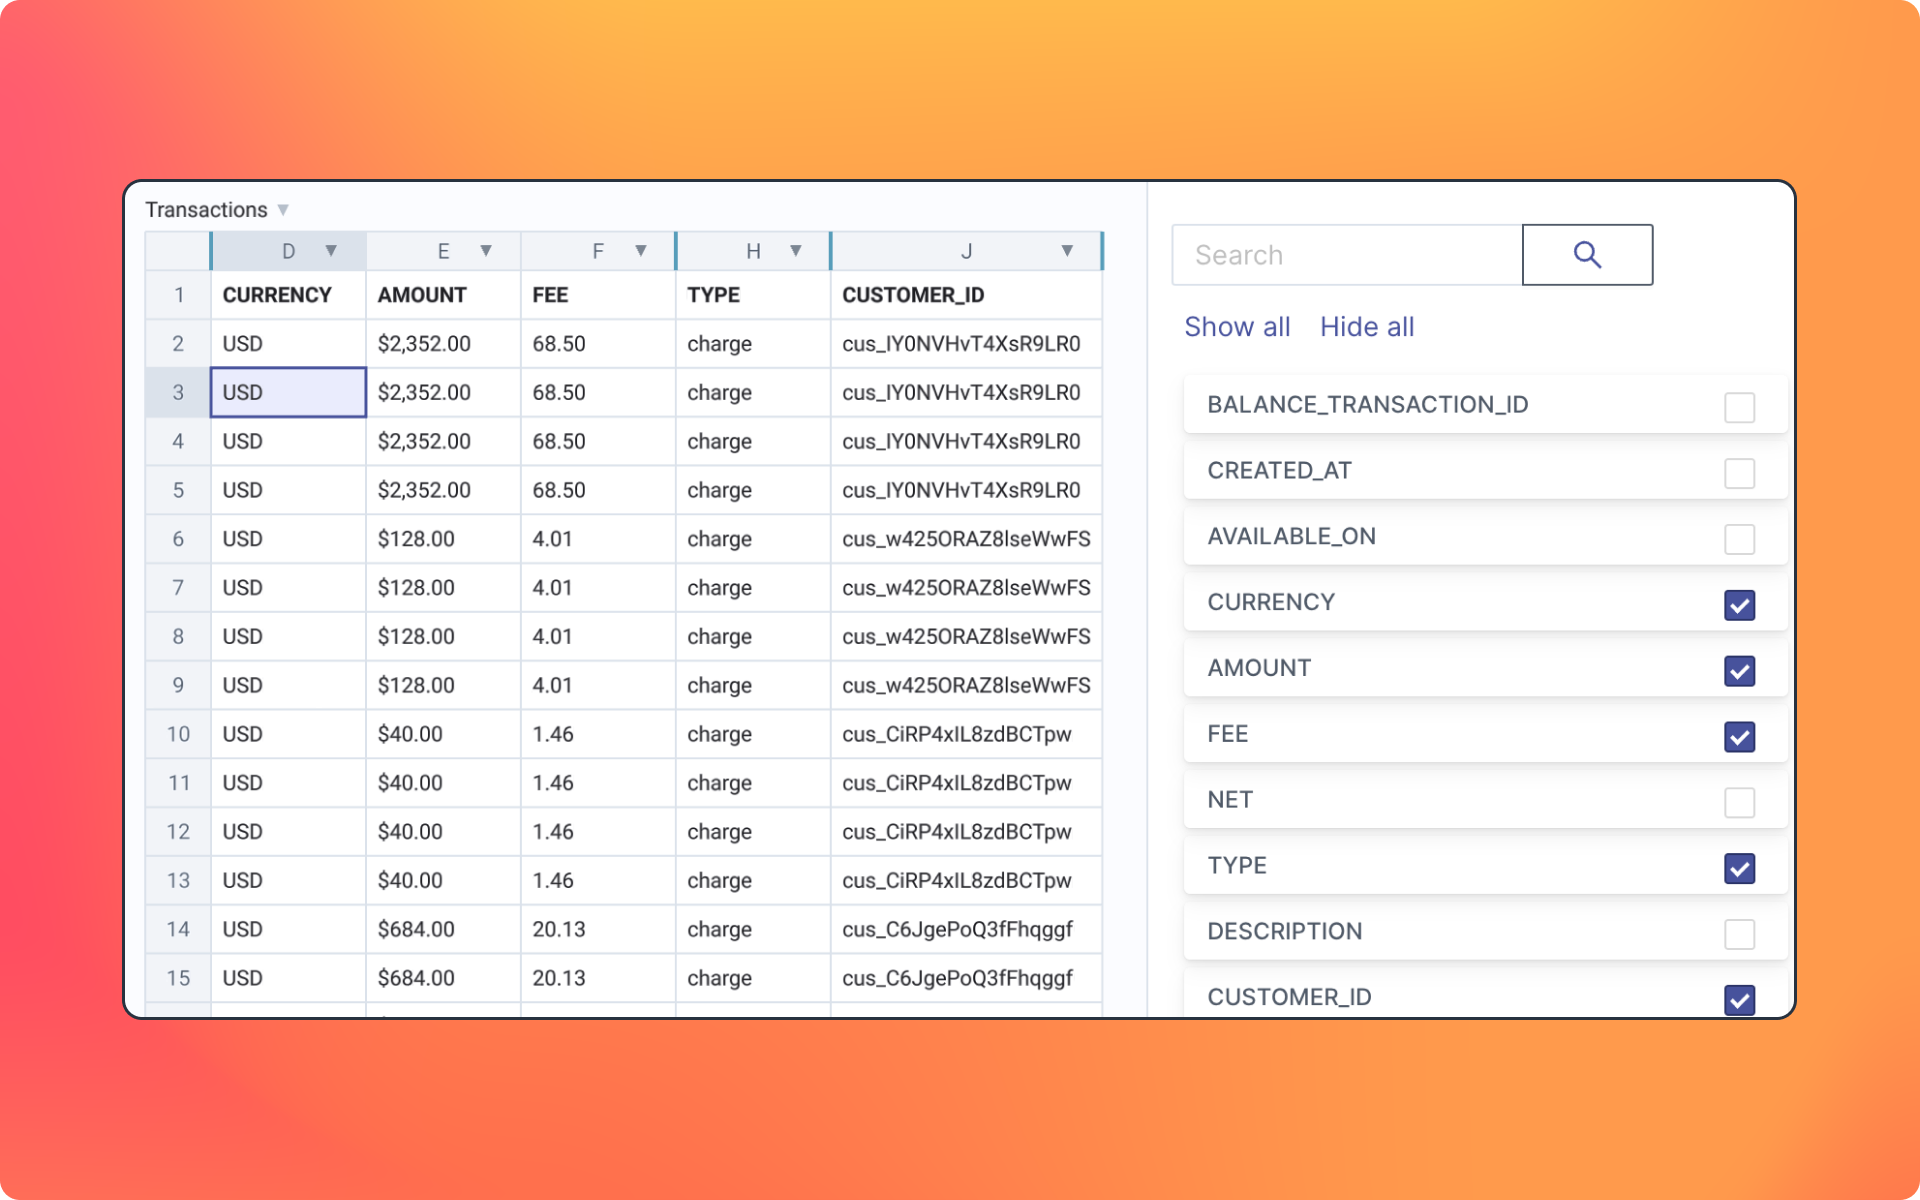
Show/hide columns
You can now mass show or hide columns. Useful for those pesky tables with a hundred columns.
Improvements
- Support connecting to Postgres via SSH tunnel
- Cleaned up chart sidebar UX
- Improved chart performance
- Charts will now autosuggest series
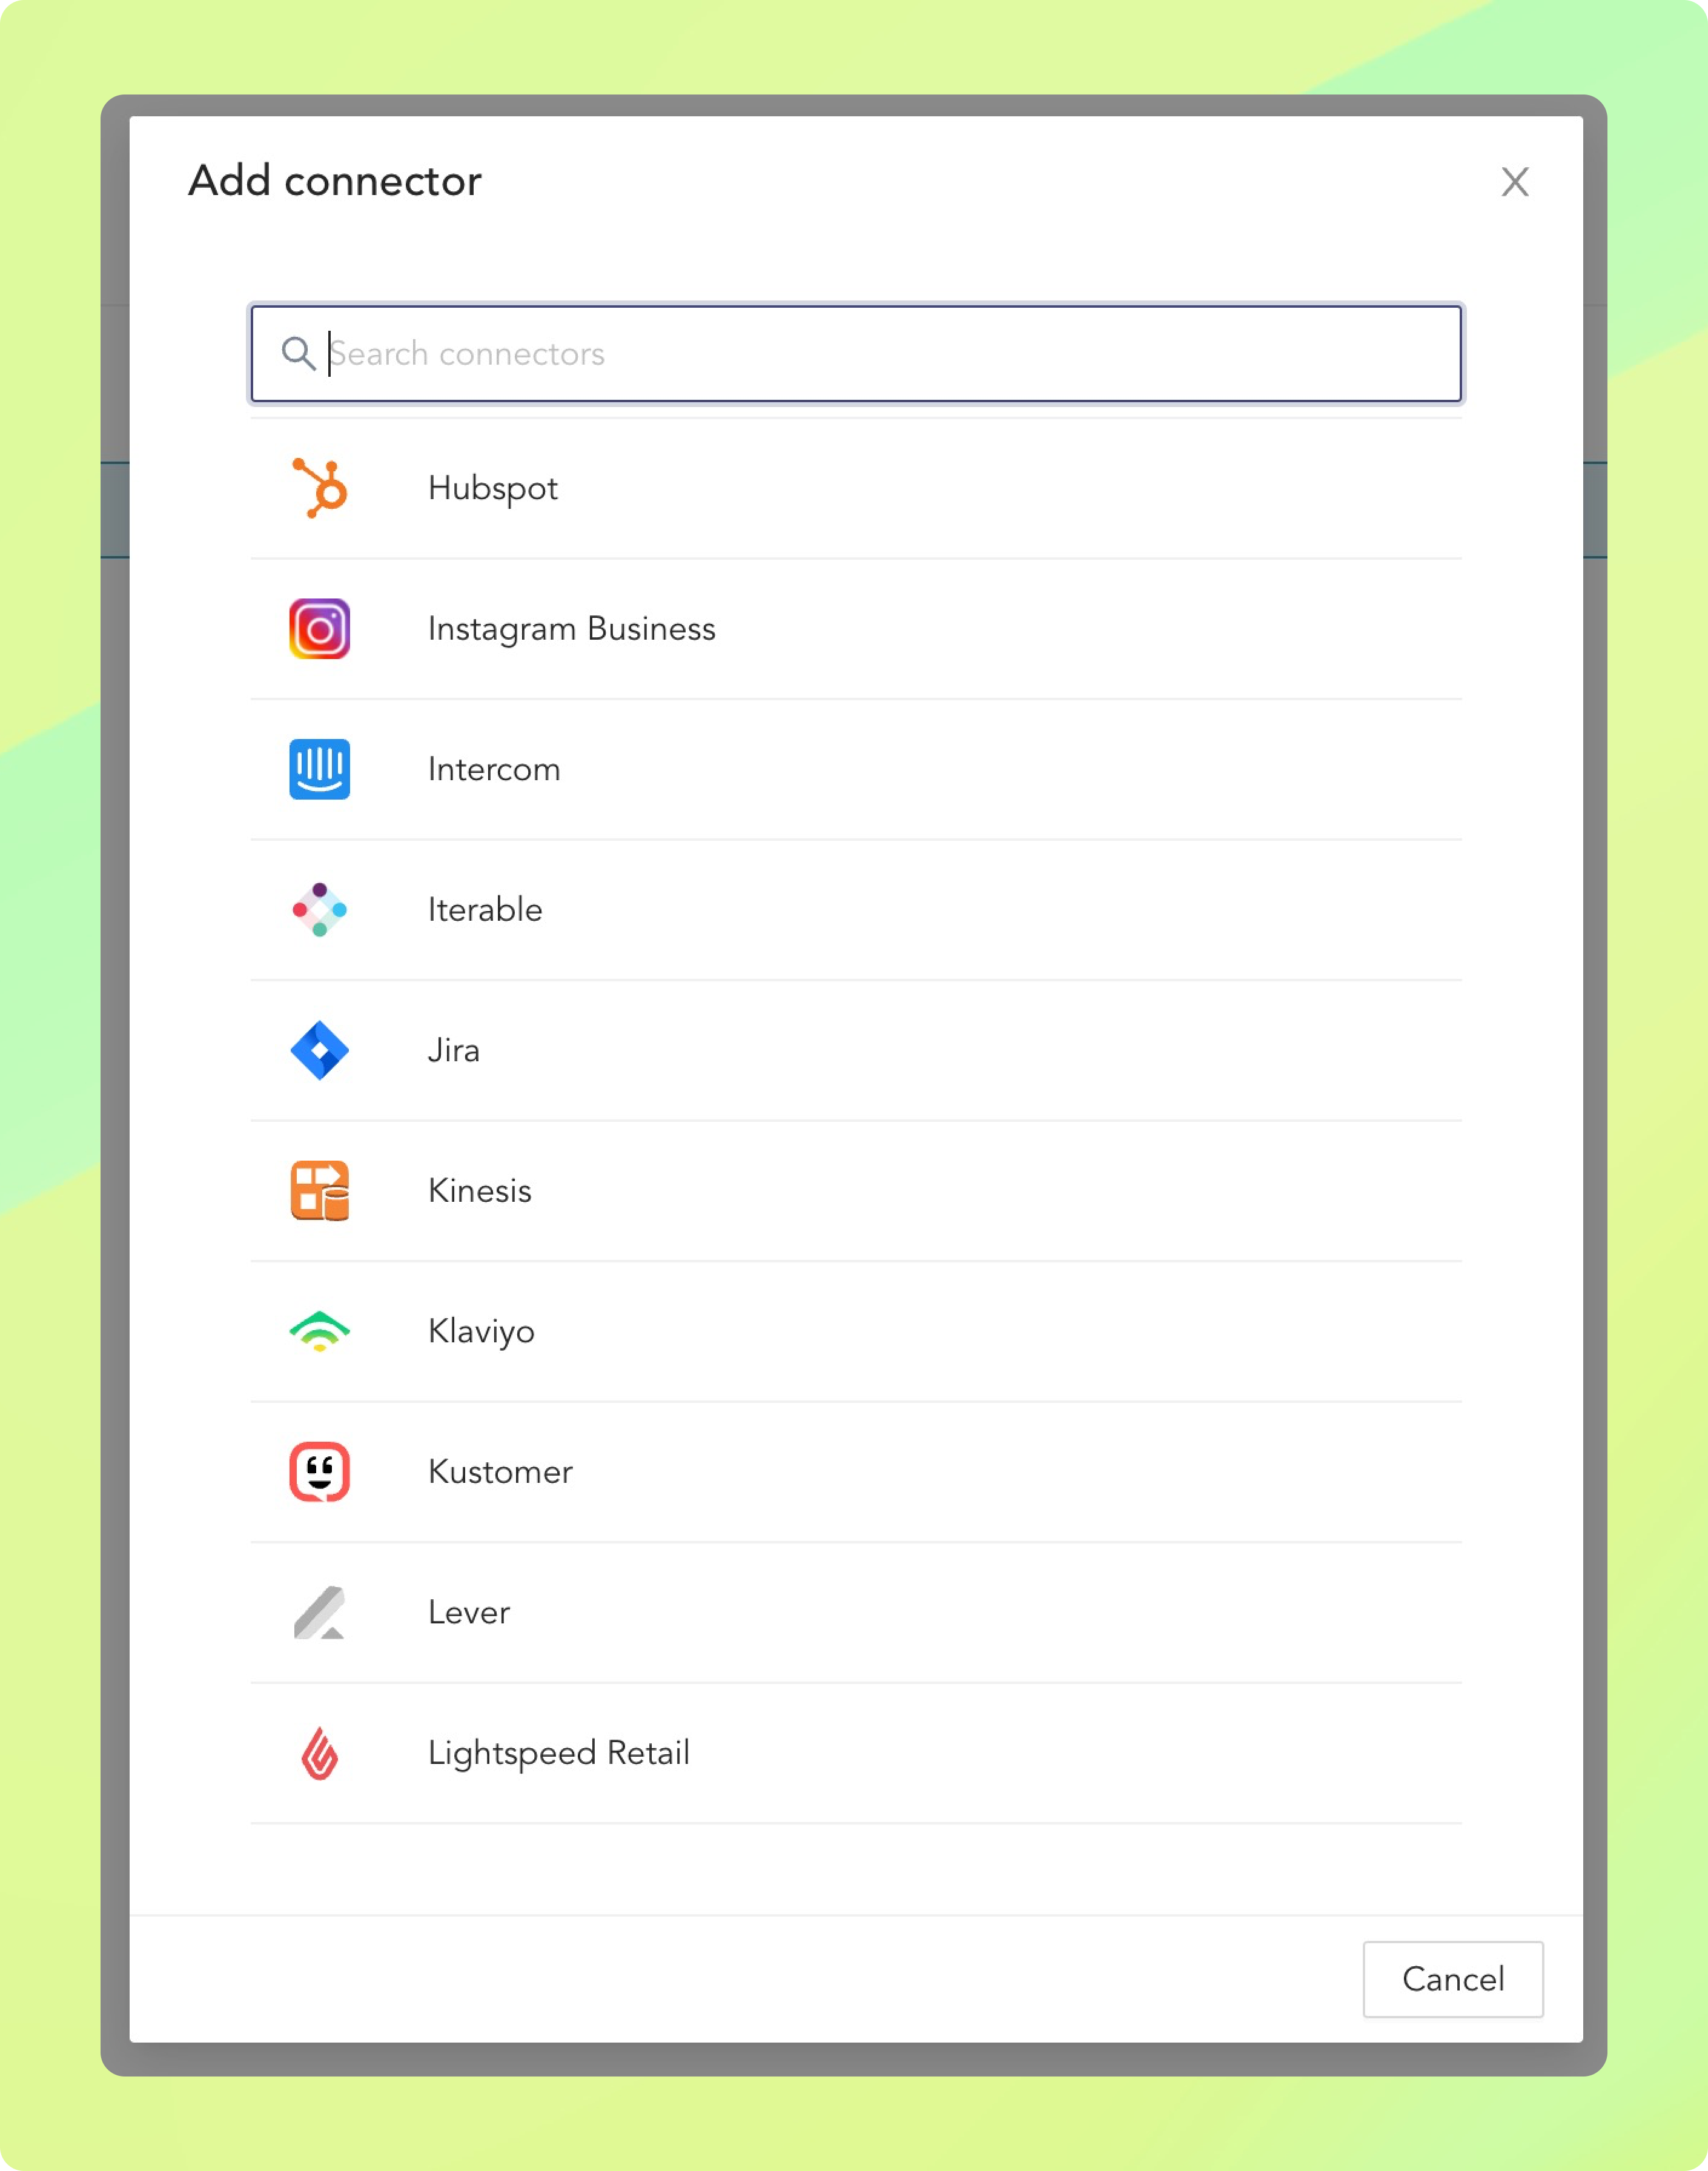
Managed warehouse
No warehouse? Explore data from any app.
Don't have a warehouse? Or just want to try out Canvas without committing to connecting your warehouse? You can now connect and explore data from hundreds of apps in minutes without code.
Head to Integrations > Managed Warehouse > Connect apps to get started. The initial connection takes just a few minutes per application.
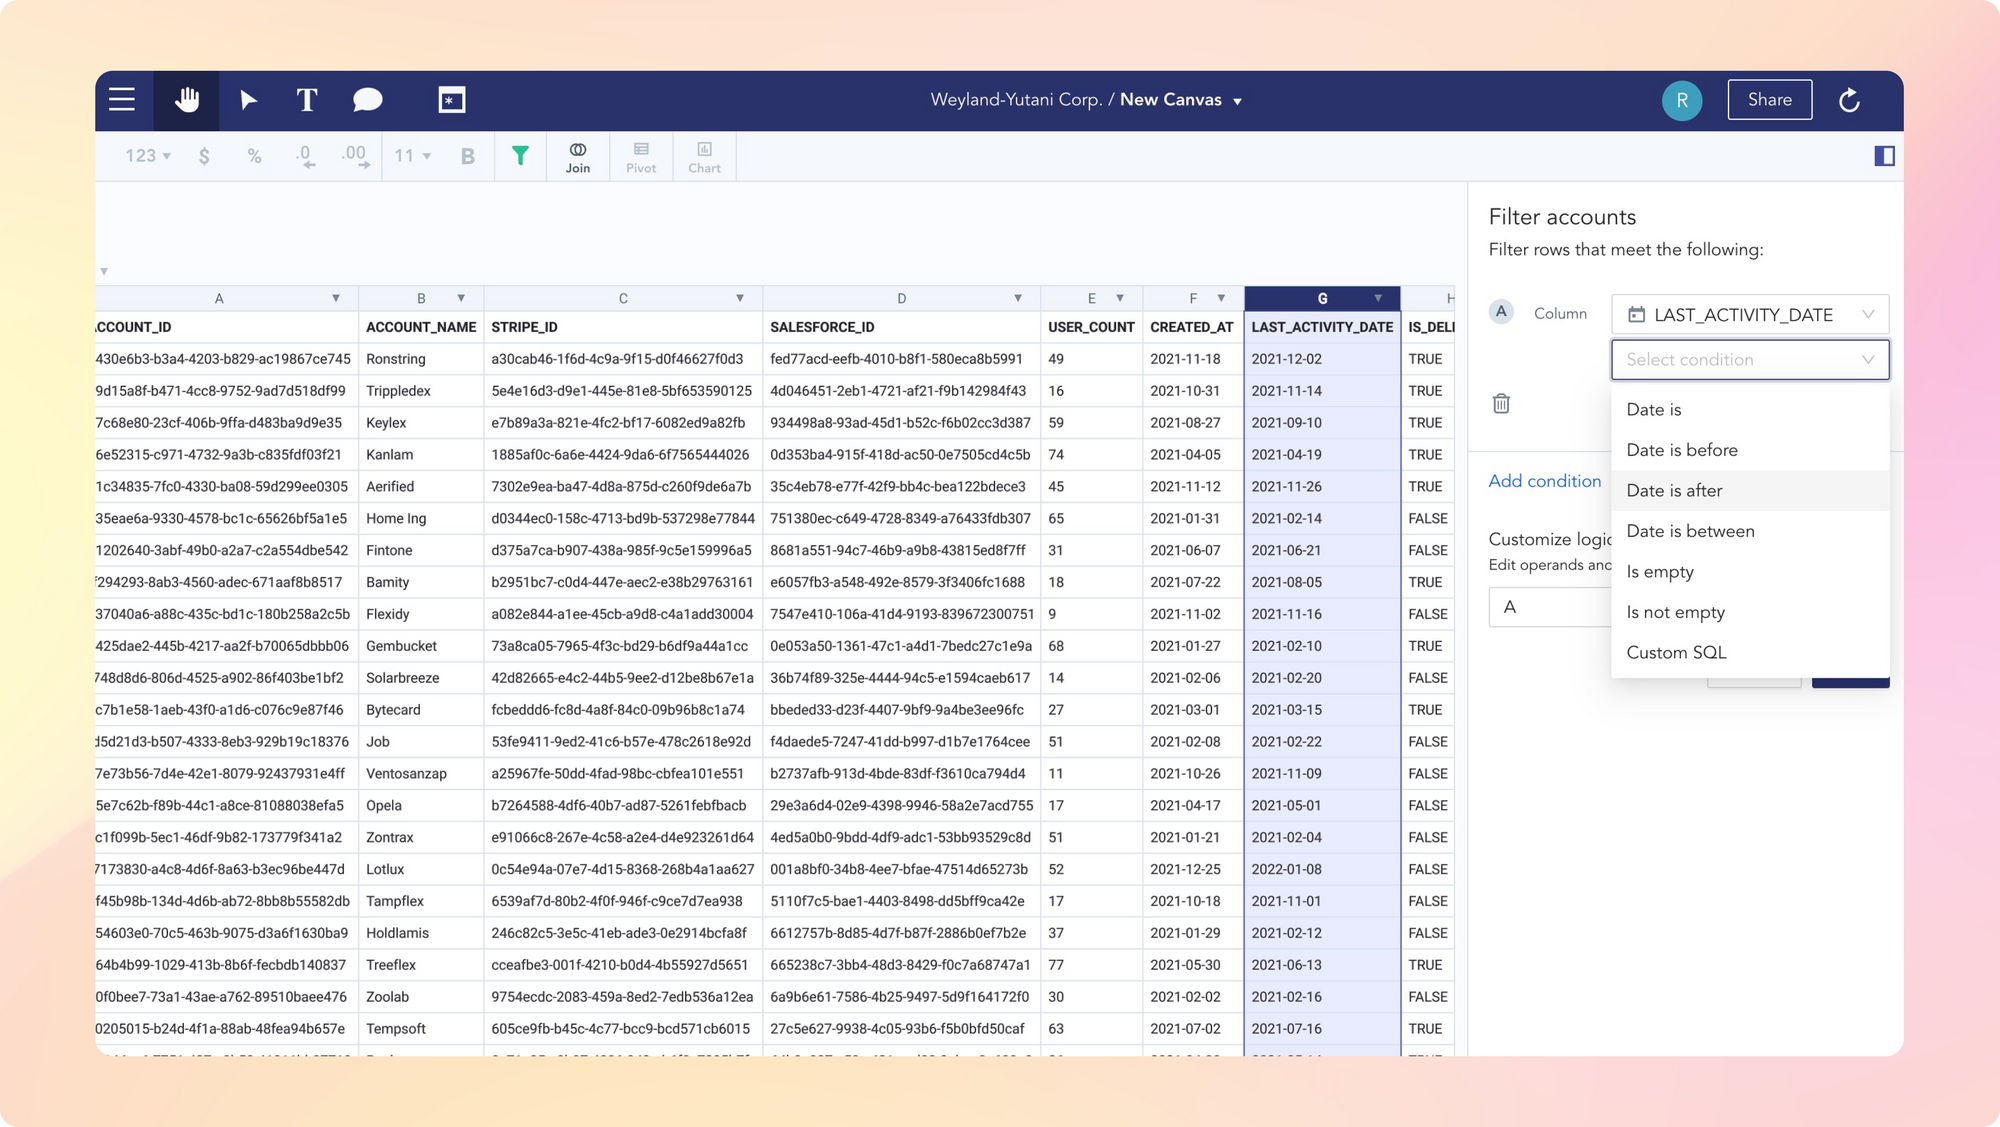
Filters and pivots now depend on column data types
Canvas is now aware of the data types of your columns. To quickly see the data types contained in your tables, open the Data Library in a canvas.
Once data is imported onto a canvas, you will now only see applicable options for a respective data type when filtering tables or creating aggregations in pivot tables.
Improvements
- Download charts as PNGs via Comand+Shift+D
- New chart tooltip styles
- Improved zooming for quickly arranging items on the canvas
- Improved dbt onboarding flow for faster job selection
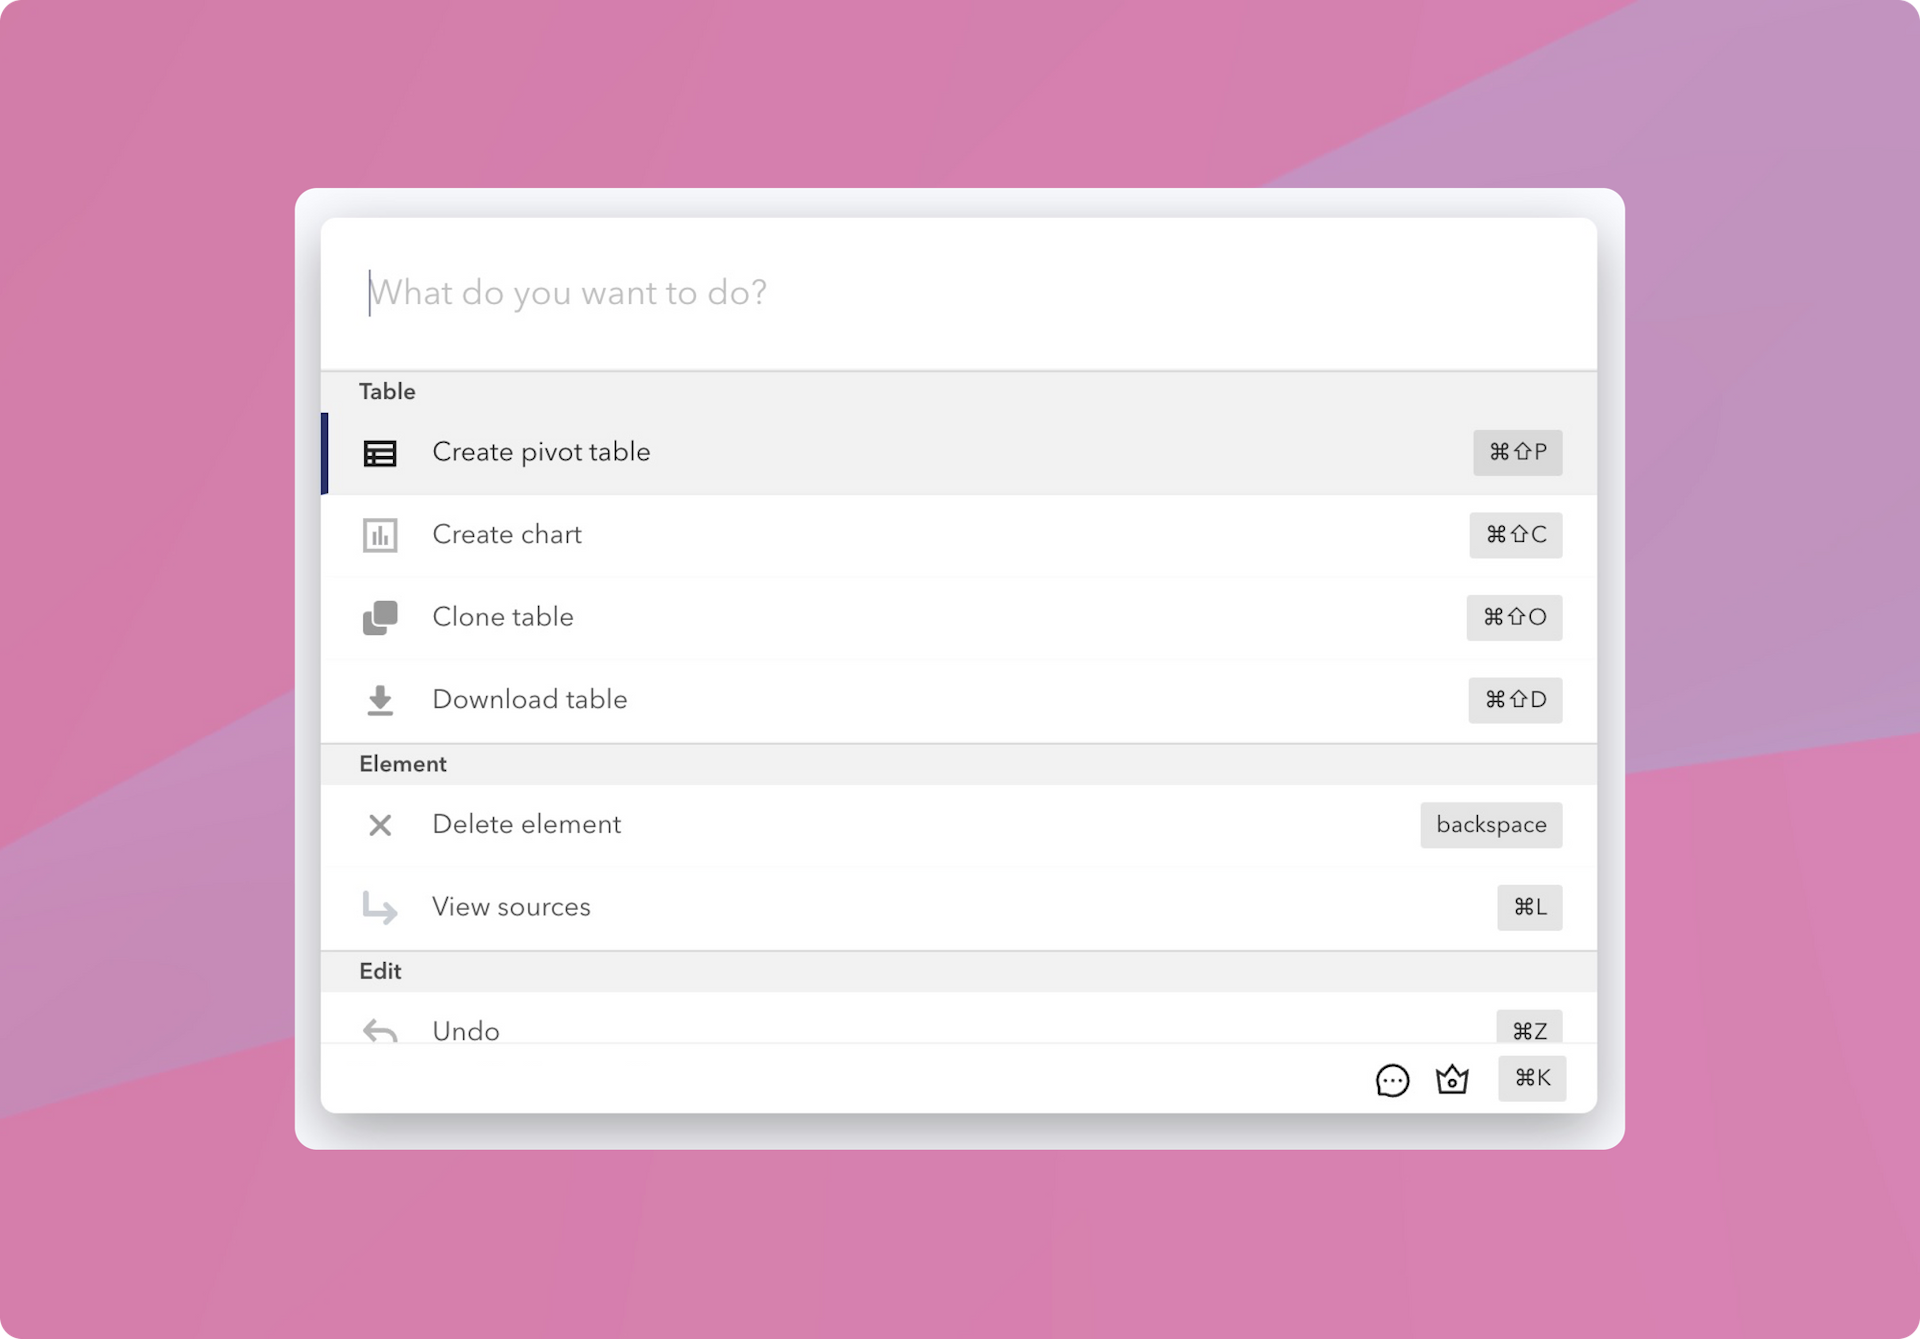
Command+K
Canvas now lets you search for any action in the tool by entering command + K. Here, you can see all actions you can take along with their keyboard shortcuts.
In addition, you can also search for terms and get quick access to our documentation.
Improvements
- Made improvements to tables so that the header row is always frozen
- Added support for undo
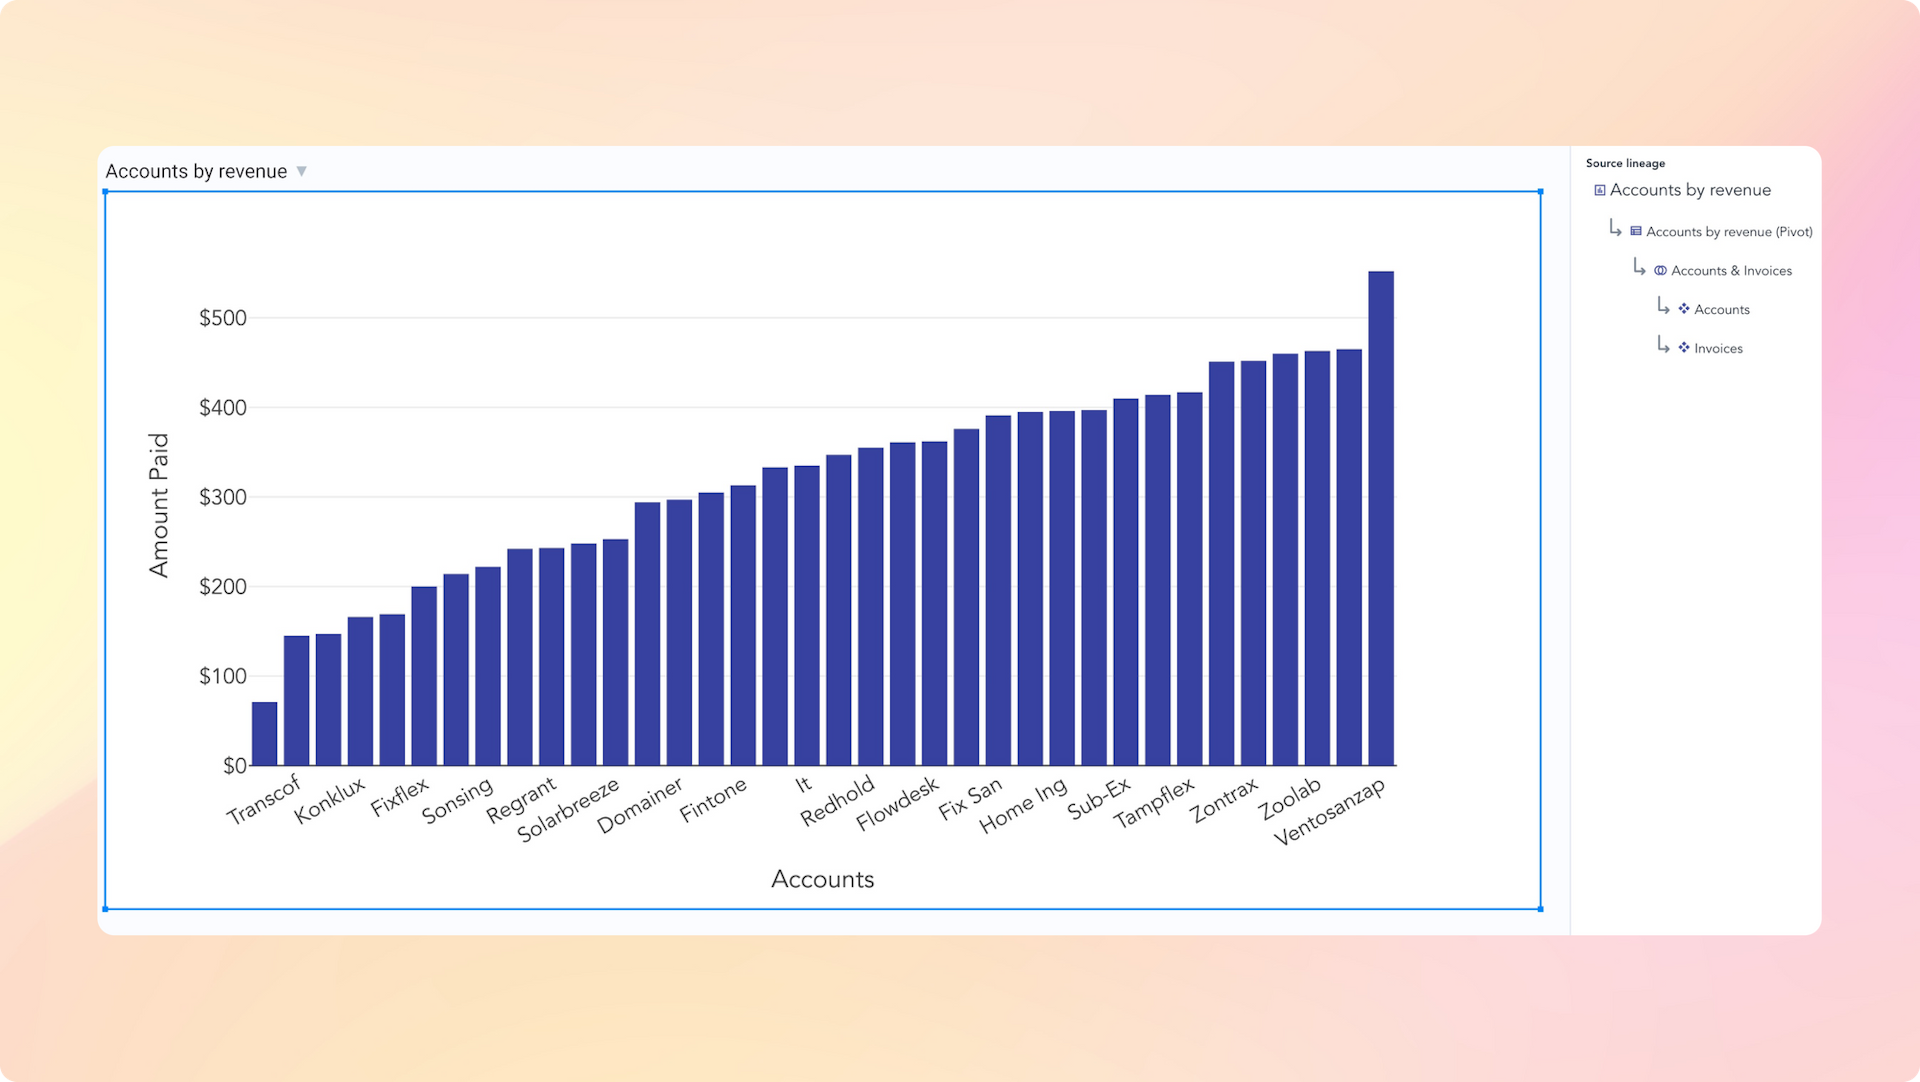
Lineage
Canvas now lets you see the lineage behind any chart or table so you can understand what underlying tables, pivot tables, or join tables were used to construct it.
Click on any of the items in the lineage tree and Canvas will direct you automatically to that table to view it. You can also hide any of these underlying tables to make the canvas cleaner and easier to navigate.
Improvements
- Added support for BigQuery
- Added ability to force a refresh of all models from the Data Library
- Added scatterplots and combo charts as chart types
- Added ability to select multiple columns at a time
- Added support for customizing chart axis labels
- Made improvements to formula entry experience
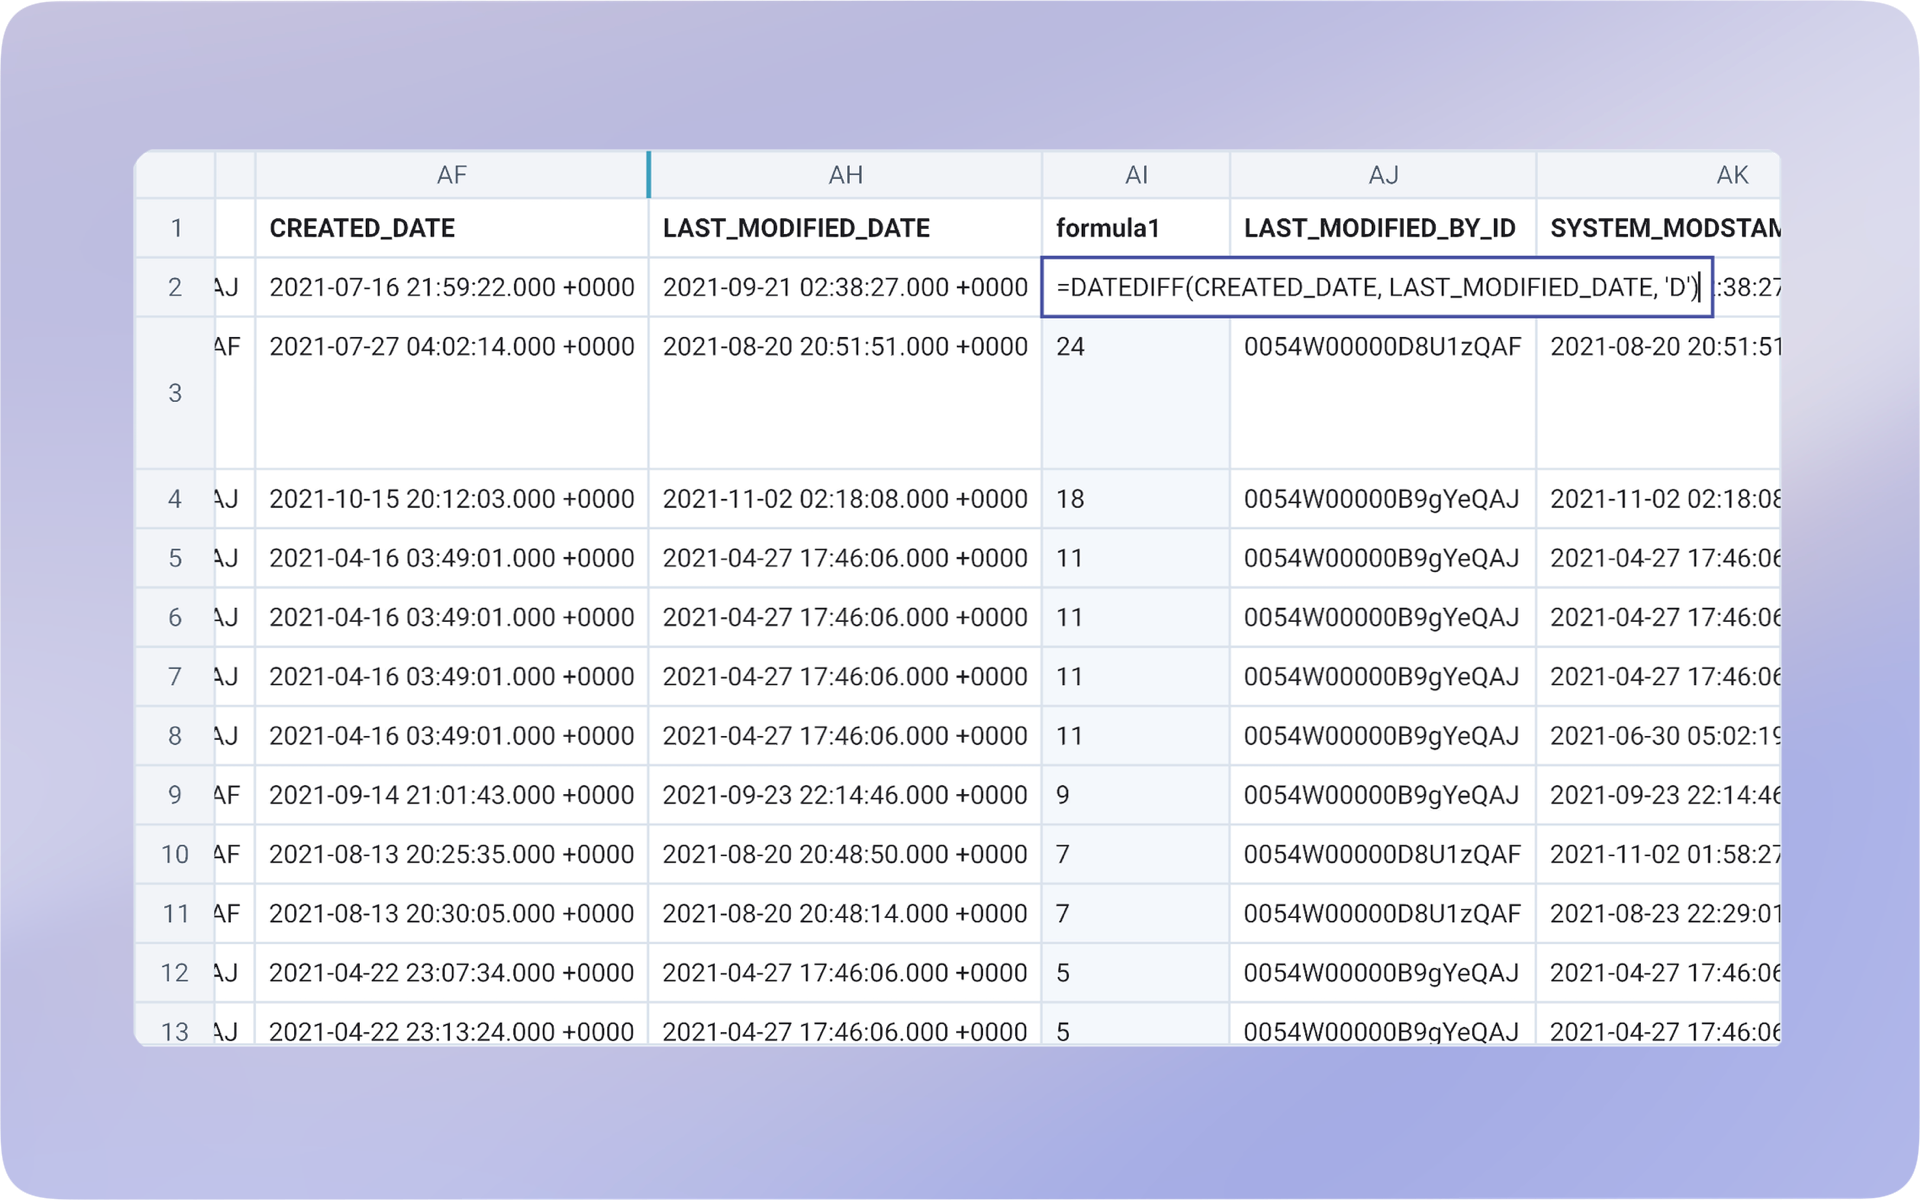
Formulas
Ever wish you could add a calculated field to your tables? You can now do that easily with formula columns!
Formulas let you use familiar spreadsheet syntax to do complex calculations based on other columns and other tables, all without opening up the SQL editor.
We're initially launching with a set of the most common spreadsheet functions, and we will be adding more over time.
Improvements
- Added support for periods in column names
- Made permission grants more explicit
- Made improvements to load times
- Made improvements to mouse navigation

Performance
We made major performance upgrades to warehouse queries. They now run asynchronously, which means we handle slow queries better.
We also added the ability to duplicate canvases, so you don't have to start from scratch to create a dashboard similar to the one you already have.
Improvements
- Fixed handling for column names that contain keywords (e.g.
FALSE) - Made it easier to tell if you are working on a private or team canvas
- Improved handling for big JSON values
- Improved column formatting
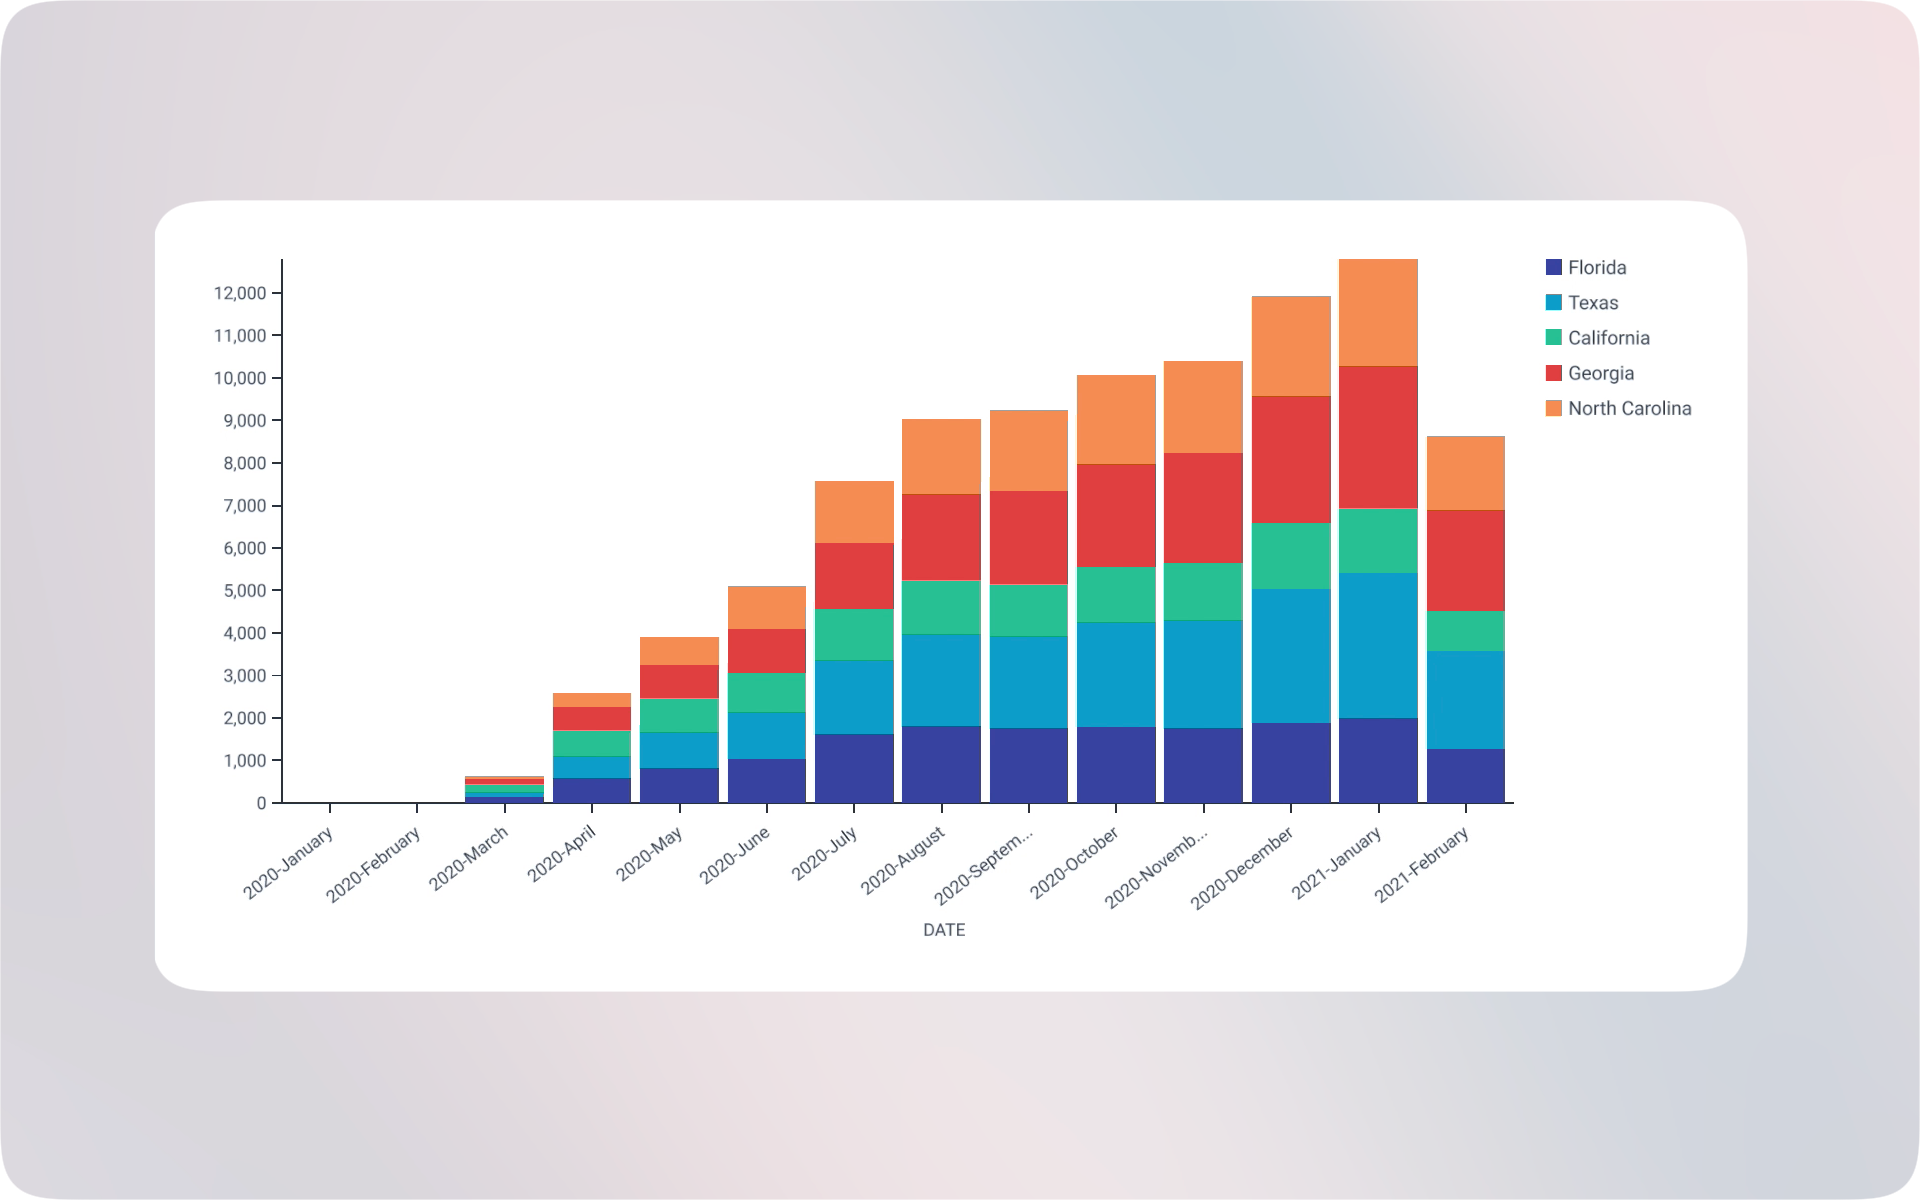
Pivot columns
We added columns to pivots. This makes it easy to make stacked charts with multiple series.
We also made it possible to sort pivots by values.
Improvements
- Added support for
QUALIFYin Postgres - Made clone SQL cleaner
- Fixed minor chart display bug
- Added better error handling for Postgres and Snowflake
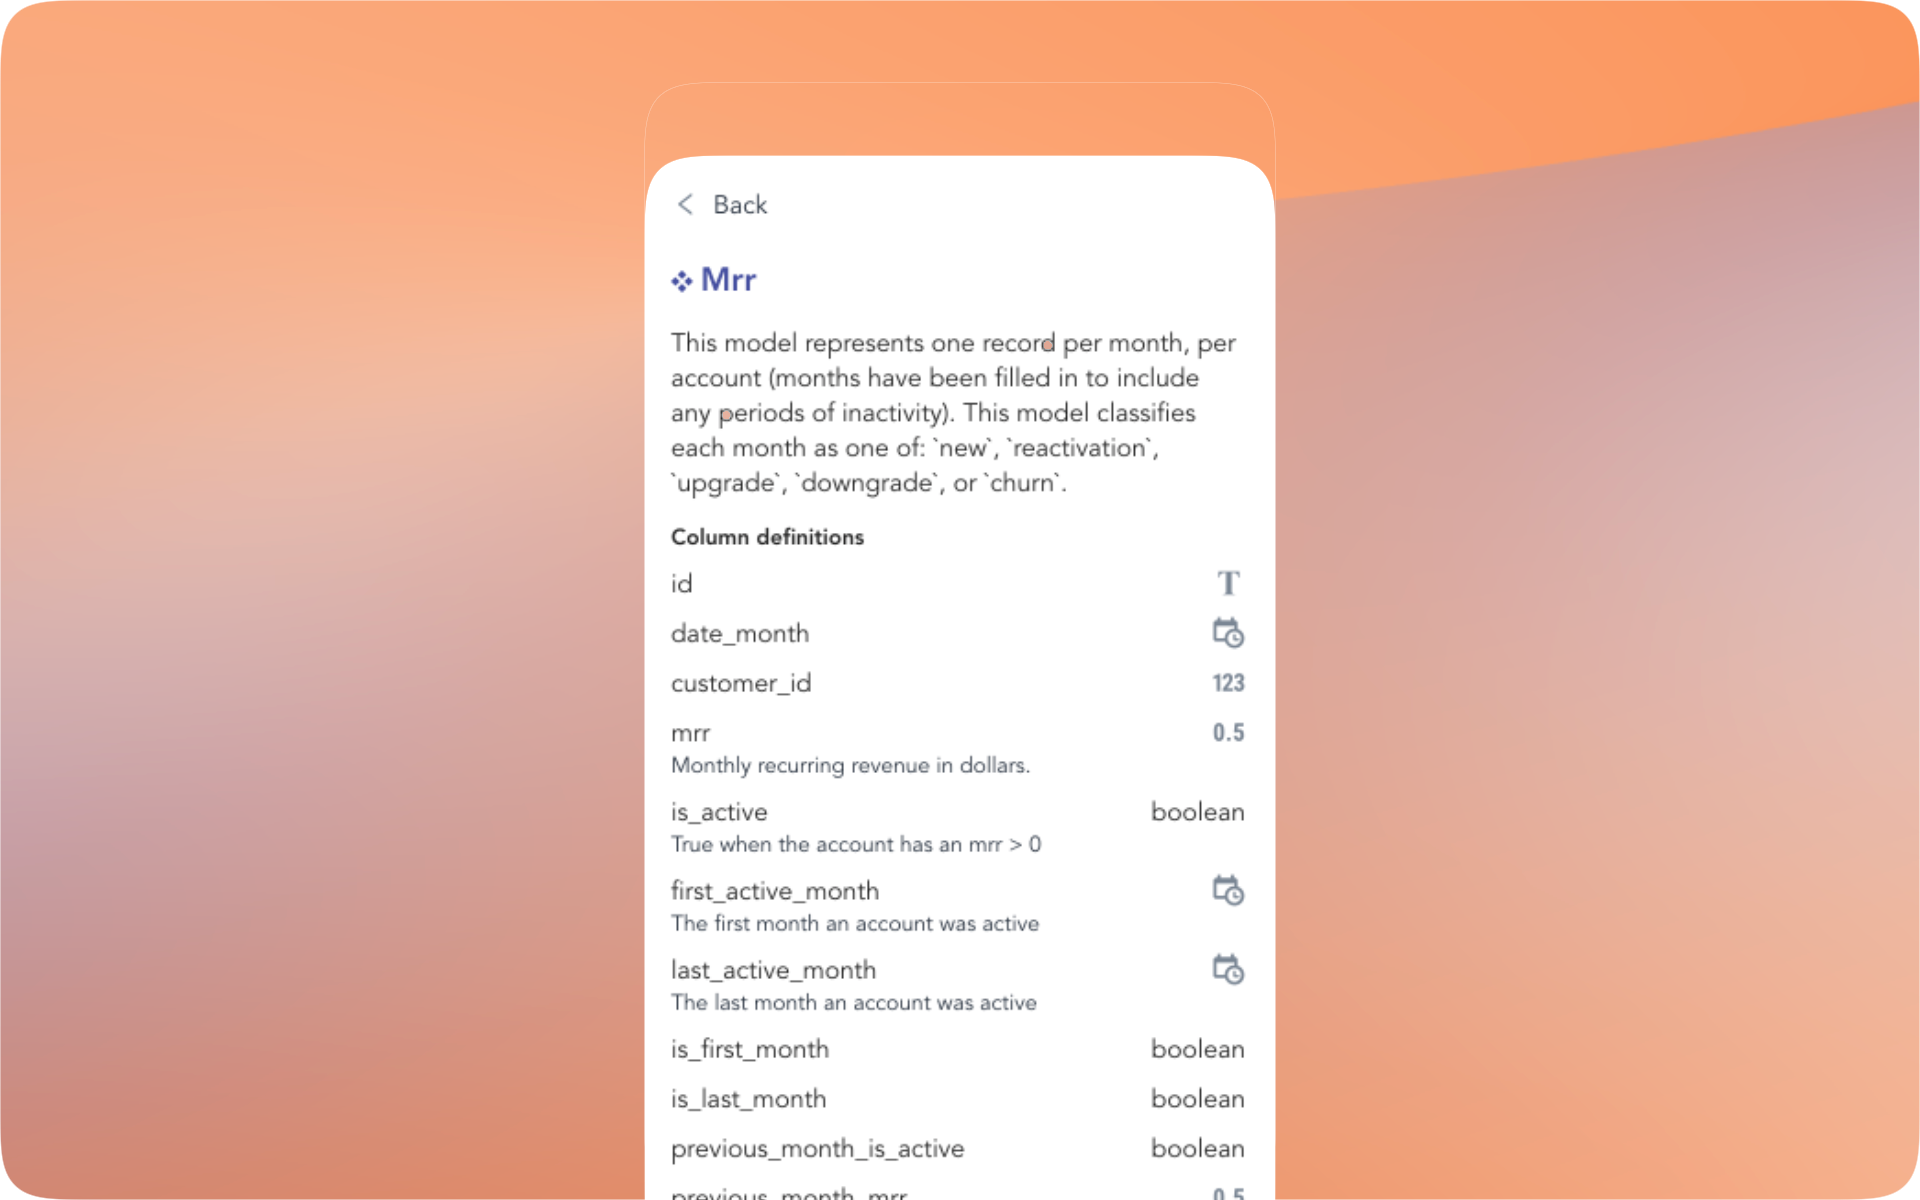
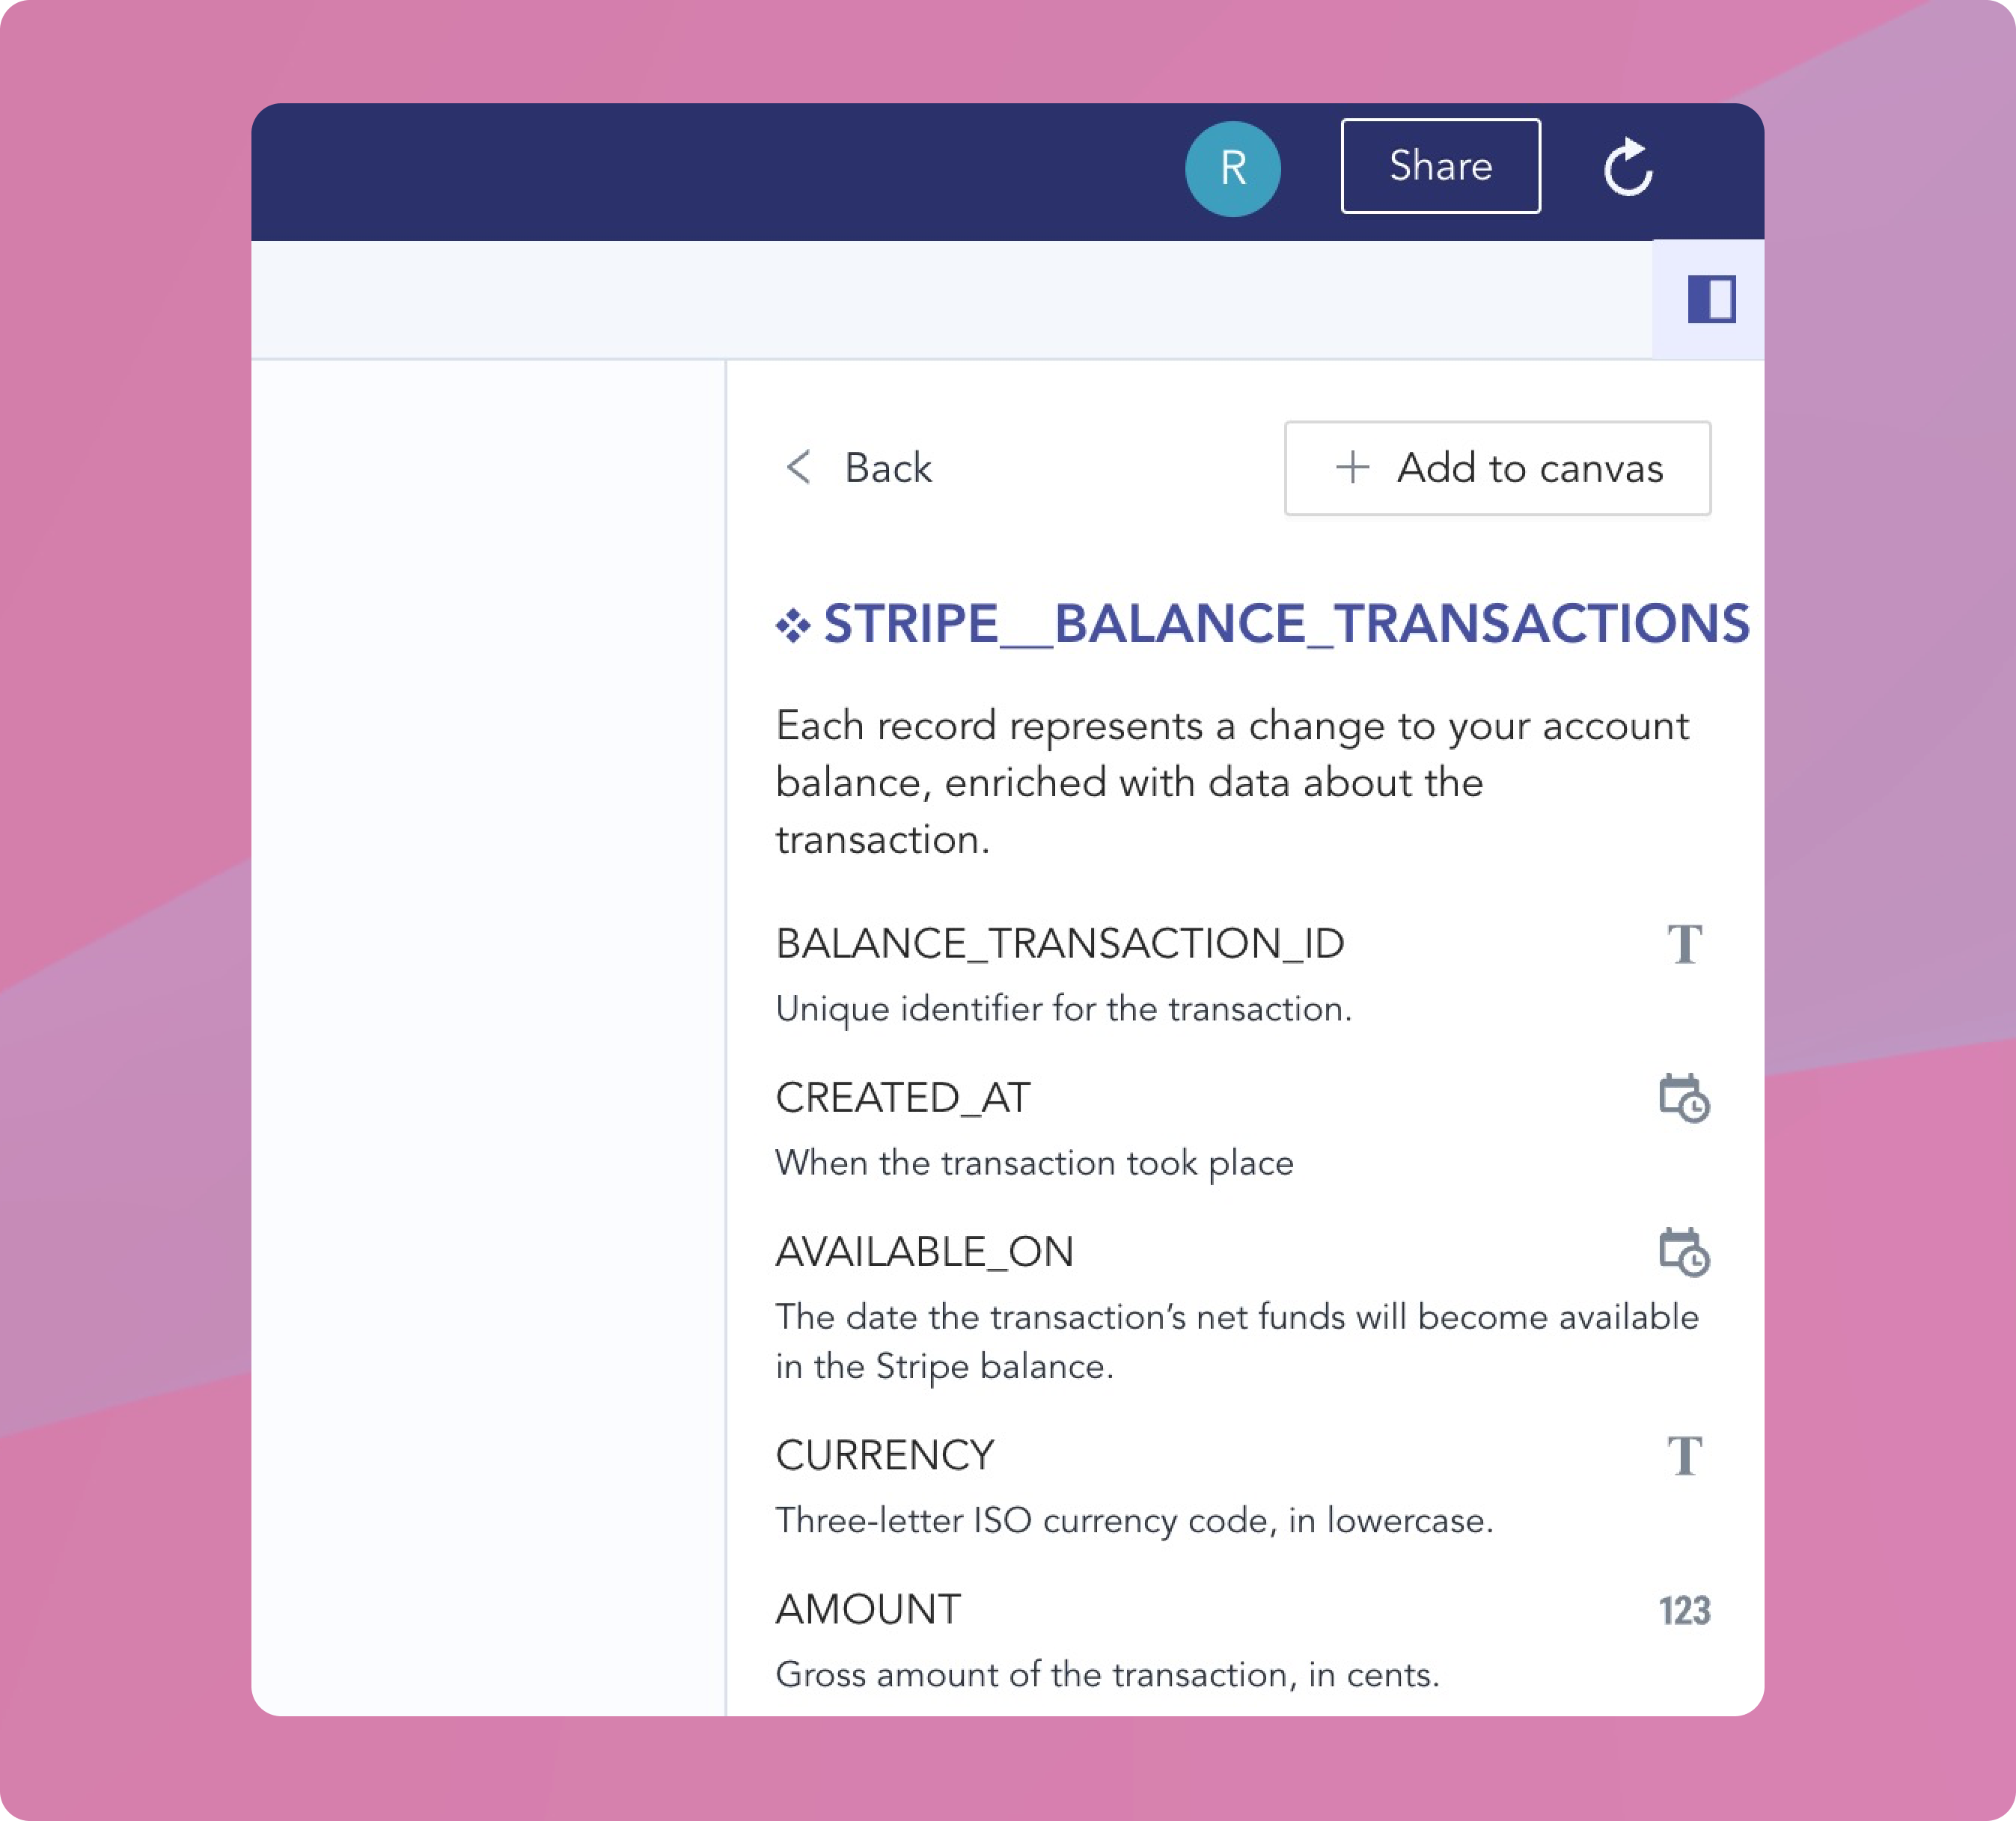
Column definitions
We added dbt column definitions to the table info sidebar. This lets you reuse the documentation you worked so hard to maintain in your models!
We also improved query performance by batching multiple queries together.
Improvements
- Fixed joins with ambiguous columns
- Fixed boolean filters
- Fixed pivoting when a cell is selected
- Added editing existing warehouse integrations
- Made minor join menu improvements